Iroquois Self-Care Disability
COMPARE
Iroquois
Select to Compare
Self-Care Disability
Iroquois Self-Care Disability
2.7%
SELF-CARE DISABILITY
0.1/ 100
METRIC RATING
279th/ 347
METRIC RANK
Iroquois Self-Care Disability Correlation Chart
The statistical analysis conducted on geographies consisting of 207,147,261 people shows a strong positive correlation between the proportion of Iroquois and percentage of population with self-care disability in the United States with a correlation coefficient (R) of 0.702 and weighted average of 2.7%. On average, for every 1% (one percent) increase in Iroquois within a typical geography, there is an increase of 0.30% in percentage of population with self-care disability.
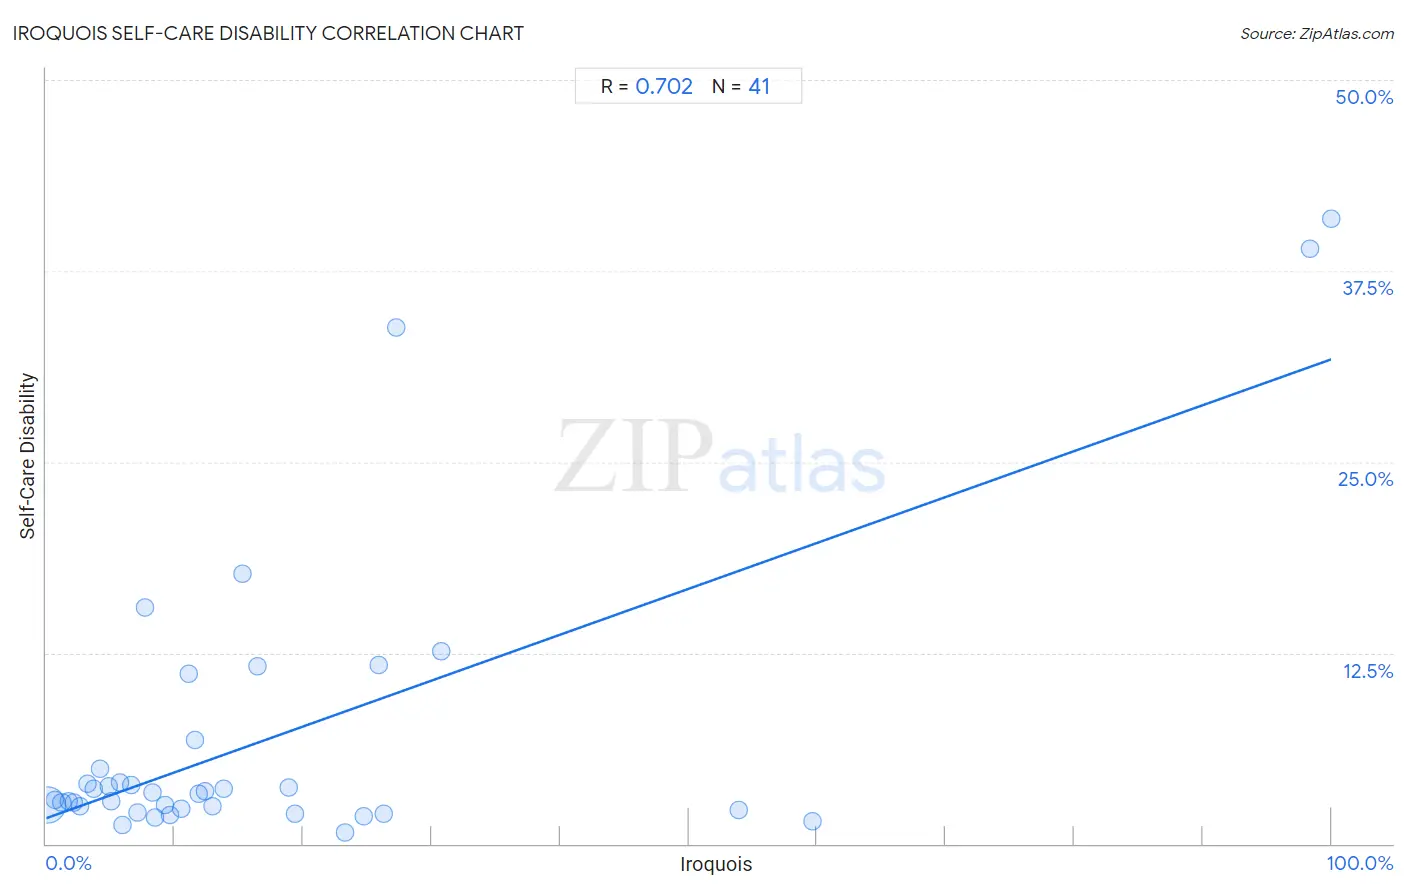
It is essential to understand that the correlation between the percentage of Iroquois and percentage of population with self-care disability does not imply a direct cause-and-effect relationship. It remains uncertain whether the presence of Iroquois influences an upward or downward trend in the level of percentage of population with self-care disability within an area, or if Iroquois simply ended up residing in those areas with higher or lower levels of percentage of population with self-care disability due to other factors.
Demographics Similar to Iroquois by Self-Care Disability
In terms of self-care disability, the demographic groups most similar to Iroquois are Hispanic or Latino (2.7%, a difference of 0.020%), Ottawa (2.7%, a difference of 0.10%), Immigrants from Ukraine (2.7%, a difference of 0.18%), Immigrants from Iraq (2.7%, a difference of 0.18%), and Apache (2.7%, a difference of 0.20%).
| Demographics | Rating | Rank | Self-Care Disability |
| Immigrants from Laos | 0.1 /100 | #272 | Tragic 2.7% |
| Mexicans | 0.1 /100 | #273 | Tragic 2.7% |
| Yakama | 0.1 /100 | #274 | Tragic 2.7% |
| Immigrants from Trinidad and Tobago | 0.1 /100 | #275 | Tragic 2.7% |
| Japanese | 0.1 /100 | #276 | Tragic 2.7% |
| Immigrants from Ukraine | 0.1 /100 | #277 | Tragic 2.7% |
| Ottawa | 0.1 /100 | #278 | Tragic 2.7% |
| Iroquois | 0.1 /100 | #279 | Tragic 2.7% |
| Hispanics or Latinos | 0.1 /100 | #280 | Tragic 2.7% |
| Immigrants from Iraq | 0.0 /100 | #281 | Tragic 2.7% |
| Apache | 0.0 /100 | #282 | Tragic 2.7% |
| Delaware | 0.0 /100 | #283 | Tragic 2.7% |
| Fijians | 0.0 /100 | #284 | Tragic 2.7% |
| Jamaicans | 0.0 /100 | #285 | Tragic 2.7% |
| French American Indians | 0.0 /100 | #286 | Tragic 2.7% |
Iroquois Self-Care Disability Correlation Summary
| Measurement | Iroquois Data | Self-Care Disability Data |
| Minimum | 0.054% | 0.76% |
| Maximum | 100.0% | 40.9% |
| Range | 99.9% | 40.1% |
| Mean | 17.6% | 7.0% |
| Median | 10.5% | 3.3% |
| Interquartile 25% (IQ1) | 4.9% | 2.3% |
| Interquartile 75% (IQ3) | 21.3% | 5.9% |
| Interquartile Range (IQR) | 16.4% | 3.6% |
| Standard Deviation (Sample) | 22.6% | 9.7% |
| Standard Deviation (Population) | 22.4% | 9.6% |
Correlation Details
| Iroquois Percentile | Sample Size | Self-Care Disability |
[ 0.0% - 0.5% ] 0.054% | 202,993,788 | 2.6% |
[ 0.5% - 1.0% ] 0.65% | 2,842,253 | 2.9% |
[ 1.0% - 1.5% ] 1.21% | 575,749 | 2.7% |
[ 1.5% - 2.0% ] 1.73% | 218,065 | 2.8% |
[ 2.0% - 2.5% ] 2.14% | 295,399 | 2.7% |
[ 2.5% - 3.0% ] 2.62% | 33,905 | 2.4% |
[ 3.0% - 3.5% ] 3.19% | 52,632 | 3.9% |
[ 3.5% - 4.0% ] 3.67% | 39,289 | 3.6% |
[ 4.0% - 4.5% ] 4.16% | 10,510 | 4.9% |
[ 4.5% - 5.0% ] 4.82% | 5,622 | 3.8% |
[ 5.0% - 5.5% ] 5.03% | 1,711 | 2.8% |
[ 5.5% - 6.0% ] 5.76% | 2,481 | 4.0% |
[ 5.5% - 6.0% ] 5.96% | 10,561 | 1.2% |
[ 6.5% - 7.0% ] 6.57% | 746 | 3.9% |
[ 7.0% - 7.5% ] 7.11% | 1,336 | 2.0% |
[ 7.5% - 8.0% ] 7.72% | 272 | 15.5% |
[ 8.0% - 8.5% ] 8.25% | 1,345 | 3.3% |
[ 8.0% - 8.5% ] 8.43% | 356 | 1.7% |
[ 9.0% - 9.5% ] 9.28% | 6,186 | 2.5% |
[ 9.5% - 10.0% ] 9.67% | 12,363 | 1.9% |
[ 10.0% - 10.5% ] 10.46% | 4,367 | 2.3% |
[ 11.0% - 11.5% ] 11.11% | 36 | 11.1% |
[ 11.5% - 12.0% ] 11.56% | 891 | 6.8% |
[ 11.5% - 12.0% ] 11.84% | 1,681 | 3.3% |
[ 12.0% - 12.5% ] 12.32% | 2,207 | 3.4% |
[ 12.5% - 13.0% ] 12.90% | 1,202 | 2.5% |
[ 13.5% - 14.0% ] 13.82% | 2,076 | 3.6% |
[ 15.0% - 15.5% ] 15.32% | 235 | 17.7% |
[ 16.0% - 16.5% ] 16.39% | 1,037 | 11.6% |
[ 18.5% - 19.0% ] 18.85% | 12,805 | 3.6% |
[ 19.0% - 19.5% ] 19.37% | 506 | 1.9% |
[ 23.0% - 23.5% ] 23.26% | 2,218 | 0.76% |
[ 24.5% - 25.0% ] 24.74% | 2,910 | 1.8% |
[ 25.5% - 26.0% ] 25.91% | 656 | 11.7% |
[ 26.0% - 26.5% ] 26.31% | 1,600 | 1.9% |
[ 27.0% - 27.5% ] 27.27% | 132 | 33.8% |
[ 30.5% - 31.0% ] 30.77% | 117 | 12.6% |
[ 53.5% - 54.0% ] 53.93% | 4,222 | 2.2% |
[ 59.5% - 60.0% ] 59.63% | 3,669 | 1.5% |
[ 98.0% - 98.5% ] 98.31% | 59 | 39.0% |
[ 99.5% - 100.0% ] 100.00% | 66 | 40.9% |