Iroquois GED/Equivalency
COMPARE
Iroquois
Select to Compare
GED/Equivalency
Iroquois GED/Equivalency
84.6%
GED/EQUIVALENCY
7.5/ 100
METRIC RATING
222nd/ 347
METRIC RANK
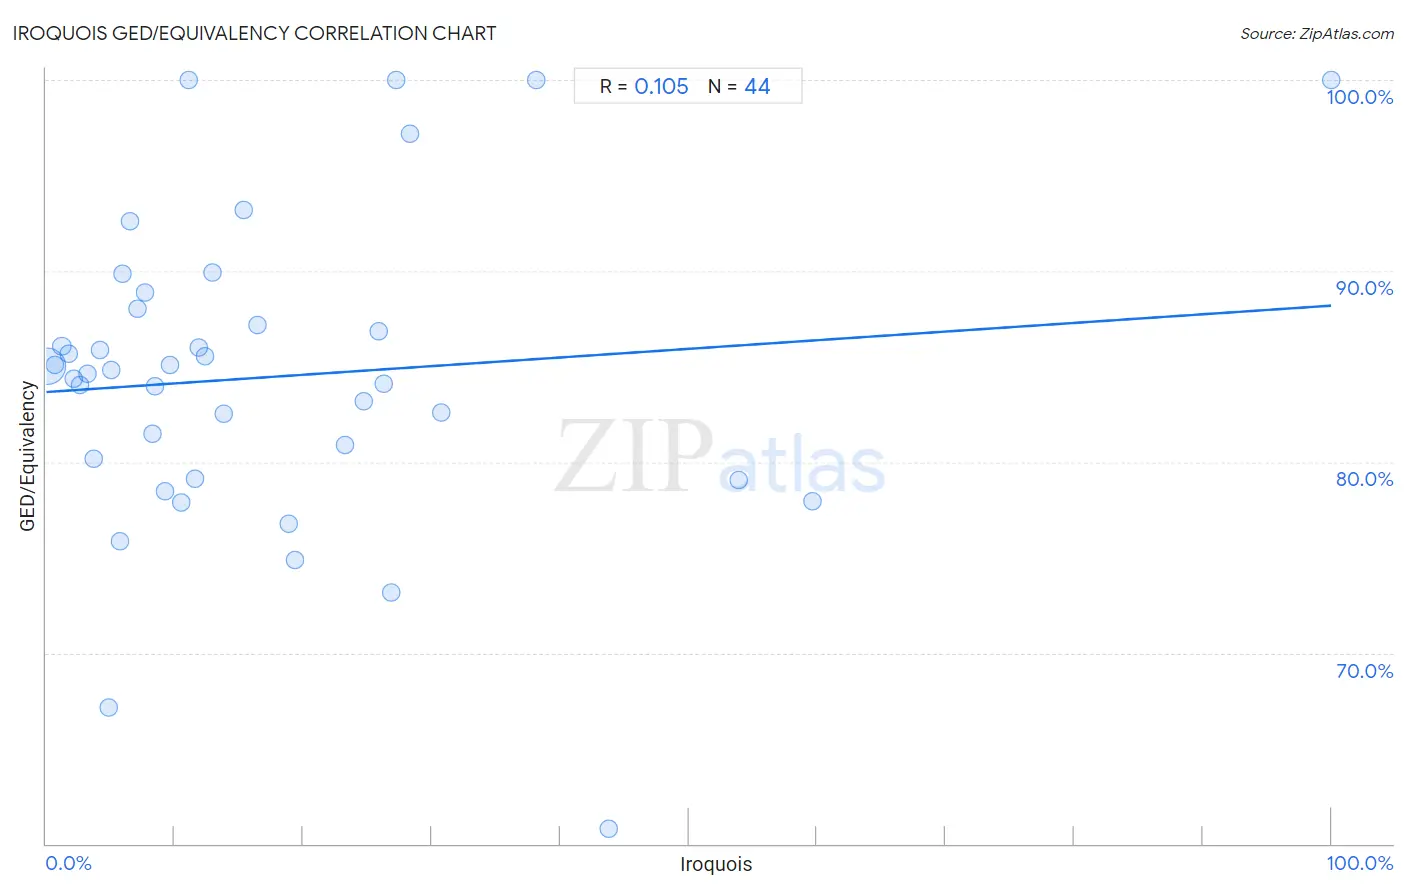
Iroquois GED/Equivalency Correlation Chart
The statistical analysis conducted on geographies consisting of 207,308,653 people shows a poor positive correlation between the proportion of Iroquois and percentage of population with at least ged/equivalency education in the United States with a correlation coefficient (R) of 0.105 and weighted average of 84.6%. On average, for every 1% (one percent) increase in Iroquois within a typical geography, there is an increase of 0.045% in percentage of population with at least ged/equivalency education.
It is essential to understand that the correlation between the percentage of Iroquois and percentage of population with at least ged/equivalency education does not imply a direct cause-and-effect relationship. It remains uncertain whether the presence of Iroquois influences an upward or downward trend in the level of percentage of population with at least ged/equivalency education within an area, or if Iroquois simply ended up residing in those areas with higher or lower levels of percentage of population with at least ged/equivalency education due to other factors.
Demographics Similar to Iroquois by GED/Equivalency
In terms of ged/equivalency, the demographic groups most similar to Iroquois are Immigrants from Uzbekistan (84.6%, a difference of 0.030%), Taiwanese (84.7%, a difference of 0.040%), Potawatomi (84.7%, a difference of 0.050%), American (84.7%, a difference of 0.050%), and Immigrants from Micronesia (84.7%, a difference of 0.080%).
| Demographics | Rating | Rank | GED/Equivalency |
| Peruvians | 9.2 /100 | #215 | Tragic 84.7% |
| Immigrants from Micronesia | 8.7 /100 | #216 | Tragic 84.7% |
| Nigerians | 8.6 /100 | #217 | Tragic 84.7% |
| Alaska Natives | 8.6 /100 | #218 | Tragic 84.7% |
| Potawatomi | 8.2 /100 | #219 | Tragic 84.7% |
| Americans | 8.2 /100 | #220 | Tragic 84.7% |
| Taiwanese | 8.1 /100 | #221 | Tragic 84.7% |
| Iroquois | 7.5 /100 | #222 | Tragic 84.6% |
| Immigrants from Uzbekistan | 7.1 /100 | #223 | Tragic 84.6% |
| French American Indians | 6.3 /100 | #224 | Tragic 84.6% |
| Immigrants from Thailand | 5.8 /100 | #225 | Tragic 84.5% |
| Immigrants from Zaire | 5.5 /100 | #226 | Tragic 84.5% |
| Immigrants from Costa Rica | 5.4 /100 | #227 | Tragic 84.5% |
| Immigrants from Liberia | 4.9 /100 | #228 | Tragic 84.4% |
| Immigrants from Uruguay | 4.6 /100 | #229 | Tragic 84.4% |
Iroquois GED/Equivalency Correlation Summary
| Measurement | Iroquois Data | GED/Equivalency Data |
| Minimum | 0.054% | 60.8% |
| Maximum | 100.0% | 100.0% |
| Range | 99.9% | 39.2% |
| Mean | 17.3% | 84.4% |
| Median | 11.3% | 84.7% |
| Interquartile 25% (IQ1) | 5.4% | 79.6% |
| Interquartile 75% (IQ3) | 25.3% | 87.6% |
| Interquartile Range (IQR) | 19.9% | 8.0% |
| Standard Deviation (Sample) | 18.9% | 8.1% |
| Standard Deviation (Population) | 18.6% | 8.0% |
Correlation Details
| Iroquois Percentile | Sample Size | GED/Equivalency |
[ 0.0% - 0.5% ] 0.054% | 203,117,358 | 85.0% |
[ 0.5% - 1.0% ] 0.65% | 2,863,117 | 85.1% |
[ 1.0% - 1.5% ] 1.21% | 581,974 | 86.1% |
[ 1.5% - 2.0% ] 1.73% | 221,781 | 85.7% |
[ 2.0% - 2.5% ] 2.14% | 295,752 | 84.4% |
[ 2.5% - 3.0% ] 2.61% | 36,567 | 84.0% |
[ 3.0% - 3.5% ] 3.19% | 53,417 | 84.6% |
[ 3.5% - 4.0% ] 3.67% | 39,289 | 80.1% |
[ 4.0% - 4.5% ] 4.15% | 11,474 | 85.9% |
[ 4.5% - 5.0% ] 4.82% | 5,622 | 67.1% |
[ 5.0% - 5.5% ] 5.07% | 2,211 | 84.8% |
[ 5.5% - 6.0% ] 5.76% | 2,481 | 75.9% |
[ 5.5% - 6.0% ] 5.96% | 10,561 | 89.8% |
[ 6.5% - 7.0% ] 6.56% | 839 | 92.6% |
[ 7.0% - 7.5% ] 7.08% | 1,568 | 88.0% |
[ 7.5% - 8.0% ] 7.72% | 272 | 88.9% |
[ 8.0% - 8.5% ] 8.25% | 1,345 | 81.5% |
[ 8.0% - 8.5% ] 8.43% | 356 | 84.0% |
[ 9.0% - 9.5% ] 9.28% | 6,186 | 78.4% |
[ 9.5% - 10.0% ] 9.67% | 12,363 | 85.1% |
[ 10.0% - 10.5% ] 10.46% | 4,367 | 77.9% |
[ 11.0% - 11.5% ] 11.11% | 36 | 100.0% |
[ 11.5% - 12.0% ] 11.58% | 1,097 | 79.1% |
[ 11.5% - 12.0% ] 11.84% | 1,681 | 86.0% |
[ 12.0% - 12.5% ] 12.32% | 2,207 | 85.5% |
[ 12.5% - 13.0% ] 12.90% | 1,202 | 89.9% |
[ 13.5% - 14.0% ] 13.82% | 2,076 | 82.5% |
[ 15.0% - 15.5% ] 15.37% | 885 | 93.2% |
[ 16.0% - 16.5% ] 16.39% | 1,037 | 87.1% |
[ 18.5% - 19.0% ] 18.85% | 12,805 | 76.7% |
[ 19.0% - 19.5% ] 19.37% | 506 | 74.8% |
[ 23.0% - 23.5% ] 23.26% | 2,218 | 80.9% |
[ 24.5% - 25.0% ] 24.74% | 2,910 | 83.1% |
[ 25.5% - 26.0% ] 25.91% | 656 | 86.8% |
[ 26.0% - 26.5% ] 26.31% | 1,600 | 84.1% |
[ 26.5% - 27.0% ] 26.83% | 205 | 73.2% |
[ 27.0% - 27.5% ] 27.27% | 132 | 100.0% |
[ 28.0% - 28.5% ] 28.26% | 138 | 97.2% |
[ 30.5% - 31.0% ] 30.77% | 117 | 82.6% |
[ 38.0% - 38.5% ] 38.12% | 160 | 100.0% |
[ 43.5% - 44.0% ] 43.75% | 128 | 60.8% |
[ 53.5% - 54.0% ] 53.93% | 4,222 | 79.1% |
[ 59.5% - 60.0% ] 59.63% | 3,669 | 77.9% |
[ 99.5% - 100.0% ] 100.00% | 66 | 100.0% |