Iroquois 1 or more Vehicles in Household

COMPARE

Iroquois
Race
Ancestry
AfghanAfricanAlaska NativeAlaskan AthabascanAlbanianAleutAlsatianAmericanApacheArabArapahoArgentineanArmenianAssyrian/Chaldean/SyriacAustralianAustrianBahamianBangladeshiBarbadianBasqueBelgianBelizeanBermudanBhutaneseBlackfeetBolivianBrazilianBritishBritish West IndianBulgarianBurmeseCajunCambodianCanadianCape VerdeanCarpatho RusynCelticCentral AmericanCentral American IndianCherokeeCheyenneChickasawChileanChineseChippewaChoctawColombianColvilleComancheCosta RicanCreeCreekCroatianCrowCubanCypriotCzechCzechoslovakianDanishDelawareDominicanDutchDutch West IndianEastern EuropeanEcuadorianEgyptianEnglishEstonianEthiopianEuropeanFijianFilipinoFinnishFrenchFrench American IndianFrench CanadianGermanGerman RussianGhanaianGreekGuamanian/ChamorroGuatemalanGuyaneseHaitianHmongHonduranHopiHoumaHungarianIcelanderIndian (Asian)IndonesianInupiatIranianIraqiIrishIroquoisIsraeliItalianJamaicanJapaneseJordanianKenyanKiowaKoreanLaotianLatvianLebaneseLiberianLithuanianLumbeeLuxembourgerMacedonianMalaysianMalteseMarshalleseMenomineeMexicanMexican American IndianMongolianMoroccanNative HawaiianNavajoNepaleseNew ZealanderNicaraguanNigerianNorthern EuropeanNorwegianOkinawanOsageOttawaPaiutePakistaniPalestinianPanamanianParaguayanPennsylvania GermanPeruvianPimaPolishPortuguesePotawatomiPuebloPuerto RicanPuget Sound SalishRomanianRussianSalvadoranSamoanScandinavianScotch-IrishScottishSeminoleSenegaleseSerbianShoshoneSierra LeoneanSiouxSlavicSlovakSloveneSomaliSouth AfricanSouth AmericanSouth American IndianSoviet UnionSpaniardSpanishSpanish AmericanSpanish American IndianSri LankanSubsaharan AfricanSudaneseSwedishSwissSyrianTaiwaneseThaiTlingit-HaidaTohono O'OdhamTonganTrinidadian and TobagonianTsimshianTurkishU.S. Virgin IslanderUgandanUkrainianUruguayanUteVenezuelanVietnameseWelshWest IndianYakamaYaquiYugoslavianYumanYup'ikZimbabwean
Immigration
NonimmigrantsImmigrantsAfghanistanAfricaAlbaniaArgentinaArmeniaAsiaAustraliaAustriaBahamasBangladeshBarbadosBelarusBelgiumBelizeBoliviaBosnia and HerzegovinaBrazilBulgariaBurma/MyanmarCabo VerdeCambodiaCameroonCanadaCaribbeanCentral AmericaChileChinaColombiaCongoCosta RicaCroatiaCubaCzechoslovakiaDenmarkDominicaDominican RepublicEastern AfricaEastern AsiaEastern EuropeEcuadorEgyptEl SalvadorEnglandEritreaEthiopiaEuropeFijiFranceGermanyGhanaGreeceGrenadaGuatemalaGuyanaHaitiHondurasHong KongHungaryIndiaIndonesiaIranIraqIrelandIsraelItalyJamaicaJapanJordanKazakhstanKenyaKoreaKuwaitLaosLatin AmericaLatviaLebanonLiberiaLithuaniaMalaysiaMexicoMicronesiaMiddle AfricaMoldovaMoroccoNepalNetherlandsNicaraguaNigeriaNorth AmericaNorth MacedoniaNorthern AfricaNorthern EuropeNorwayOceaniaPakistanPanamaPeruPhilippinesPolandPortugalRomaniaRussiaSaudi ArabiaScotlandSenegalSerbiaSierra LeoneSingaporeSomaliaSouth AfricaSouth AmericaSouth Central AsiaSouth Eastern AsiaSouthern EuropeSpainSri LankaSt. Vincent and the GrenadinesSudanSwedenSwitzerlandSyriaTaiwanThailandTrinidad and TobagoTurkeyUgandaUkraineUruguayUzbekistanVenezuelaVietnamWest IndiesWestern AfricaWestern AsiaWestern EuropeYemenZaireZimbabweAzores
Select to Compare
Race
Ancestry
AfghanAfricanAlaska NativeAlaskan AthabascanAlbanianAleutAlsatianAmericanApacheArabArapahoArgentineanArmenianAssyrian/Chaldean/SyriacAustralianAustrianBahamianBangladeshiBarbadianBasqueBelgianBelizeanBermudanBhutaneseBlackfeetBolivianBrazilianBritishBritish West IndianBulgarianBurmeseCajunCambodianCanadianCape VerdeanCarpatho RusynCelticCentral AmericanCentral American IndianCherokeeCheyenneChickasawChileanChineseChippewaChoctawColombianColvilleComancheCosta RicanCreeCreekCroatianCrowCubanCypriotCzechCzechoslovakianDanishDelawareDominicanDutchDutch West IndianEastern EuropeanEcuadorianEgyptianEnglishEstonianEthiopianEuropeanFijianFilipinoFinnishFrenchFrench American IndianFrench CanadianGermanGerman RussianGhanaianGreekGuamanian/ChamorroGuatemalanGuyaneseHaitianHmongHonduranHopiHoumaHungarianIcelanderIndian (Asian)IndonesianInupiatIranianIraqiIrishIsraeliItalianJamaicanJapaneseJordanianKenyanKiowaKoreanLaotianLatvianLebaneseLiberianLithuanianLumbeeLuxembourgerMacedonianMalaysianMalteseMarshalleseMenomineeMexicanMexican American IndianMongolianMoroccanNative HawaiianNavajoNepaleseNew ZealanderNicaraguanNigerianNorthern EuropeanNorwegianOkinawanOsageOttawaPaiutePakistaniPalestinianPanamanianParaguayanPennsylvania GermanPeruvianPimaPolishPortuguesePotawatomiPuebloPuerto RicanPuget Sound SalishRomanianRussianSalvadoranSamoanScandinavianScotch-IrishScottishSeminoleSenegaleseSerbianShoshoneSierra LeoneanSiouxSlavicSlovakSloveneSomaliSouth AfricanSouth AmericanSouth American IndianSoviet UnionSpaniardSpanishSpanish AmericanSpanish American IndianSri LankanSubsaharan AfricanSudaneseSwedishSwissSyrianTaiwaneseThaiTlingit-HaidaTohono O'OdhamTonganTrinidadian and TobagonianTsimshianTurkishU.S. Virgin IslanderUgandanUkrainianUruguayanUteVenezuelanVietnameseWelshWest IndianYakamaYaquiYugoslavianYumanYup'ikZimbabwean
Immigration
NonimmigrantsImmigrantsAfghanistanAfricaAlbaniaArgentinaArmeniaAsiaAustraliaAustriaBahamasBangladeshBarbadosBelarusBelgiumBelizeBoliviaBosnia and HerzegovinaBrazilBulgariaBurma/MyanmarCabo VerdeCambodiaCameroonCanadaCaribbeanCentral AmericaChileChinaColombiaCongoCosta RicaCroatiaCubaCzechoslovakiaDenmarkDominicaDominican RepublicEastern AfricaEastern AsiaEastern EuropeEcuadorEgyptEl SalvadorEnglandEritreaEthiopiaEuropeFijiFranceGermanyGhanaGreeceGrenadaGuatemalaGuyanaHaitiHondurasHong KongHungaryIndiaIndonesiaIranIraqIrelandIsraelItalyJamaicaJapanJordanKazakhstanKenyaKoreaKuwaitLaosLatin AmericaLatviaLebanonLiberiaLithuaniaMalaysiaMexicoMicronesiaMiddle AfricaMoldovaMoroccoNepalNetherlandsNicaraguaNigeriaNorth AmericaNorth MacedoniaNorthern AfricaNorthern EuropeNorwayOceaniaPakistanPanamaPeruPhilippinesPolandPortugalRomaniaRussiaSaudi ArabiaScotlandSenegalSerbiaSierra LeoneSingaporeSomaliaSouth AfricaSouth AmericaSouth Central AsiaSouth Eastern AsiaSouthern EuropeSpainSri LankaSt. Vincent and the GrenadinesSudanSwedenSwitzerlandSyriaTaiwanThailandTrinidad and TobagoTurkeyUgandaUkraineUruguayUzbekistanVenezuelaVietnamWest IndiesWestern AfricaWestern AsiaWestern EuropeYemenZaireZimbabweAzores
1 or more Vehicles in Household
Income
Poverty
Unemployment
Labor Participation
Family Structure
Vehicle Availability
Education Level
Disability

Iroquois 1 or more Vehicles in Household
Poor

89.2%
1+ VEHICLES AVAILABLE
19.8/ 100
METRIC RATING
202nd/ 347
METRIC RANK

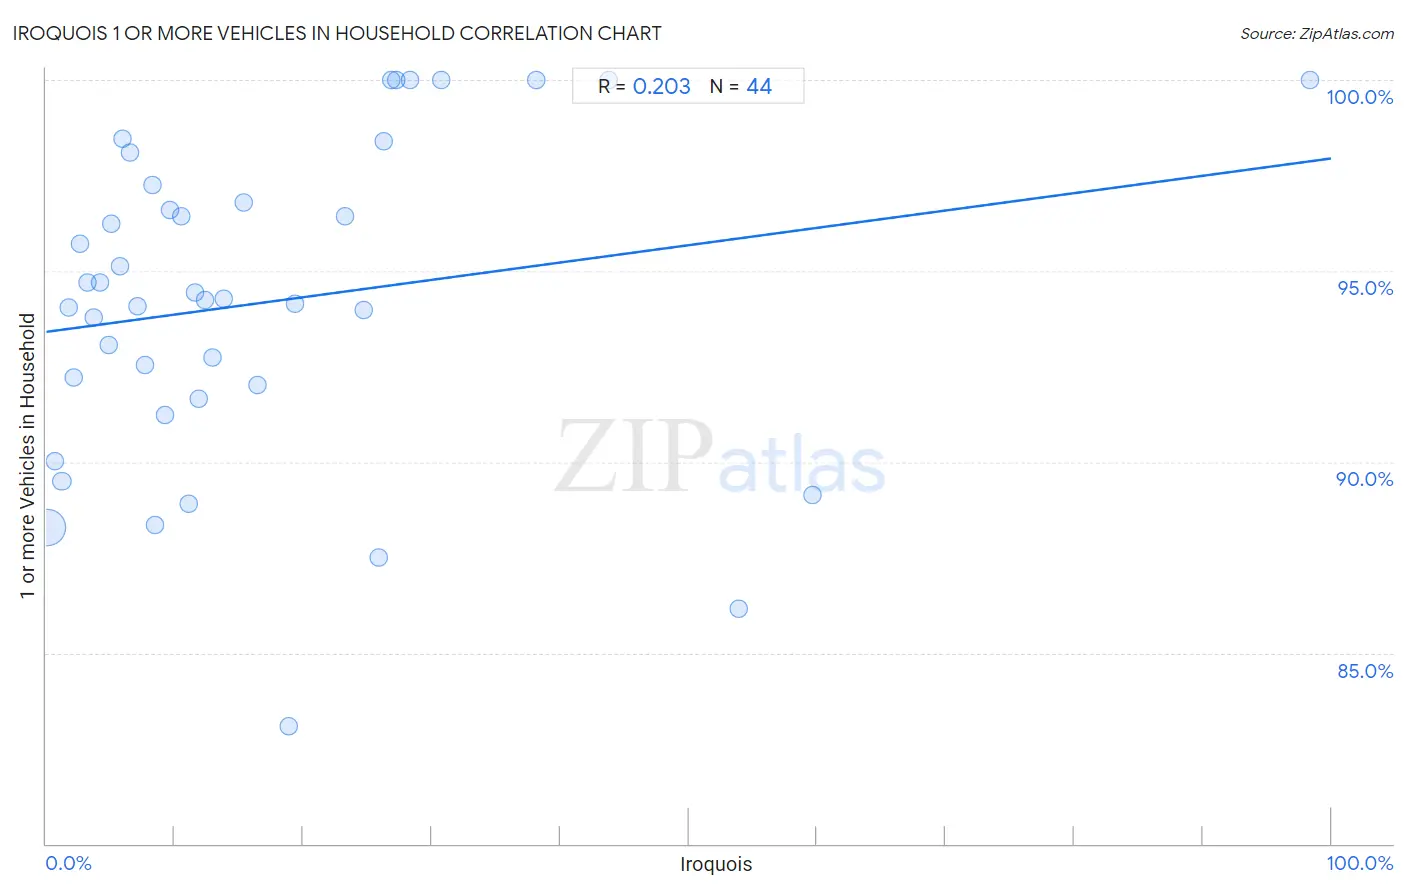
Iroquois 1 or more Vehicles in Household Correlation Chart

The statistical analysis conducted on geographies consisting of 207,261,680 people shows a weak positive correlation between the proportion of Iroquois and percentage of households with 1 or more vehicles available in the United States with a correlation coefficient (R) of 0.203 and weighted average of 89.2%. On average, for every 1% (one percent) increase in Iroquois within a typical geography, there is an increase of 0.045% in percentage of households with 1 or more vehicles available.
Iroquois 1 or more Vehicles in Household
It is essential to understand that the correlation between the percentage of Iroquois and percentage of households with 1 or more vehicles available does not imply a direct cause-and-effect relationship. It remains uncertain whether the presence of Iroquois influences an upward or downward trend in the level of percentage of households with 1 or more vehicles available within an area, or if Iroquois simply ended up residing in those areas with higher or lower levels of percentage of households with 1 or more vehicles available due to other factors.

Demographics Similar to Iroquois by 1 or more Vehicles in Household

In terms of 1 or more vehicles in household, the demographic groups most similar to Iroquois are Immigrants from Western Europe (89.2%, a difference of 0.020%), Cambodian (89.2%, a difference of 0.020%), Central American (89.2%, a difference of 0.040%), Romanian (89.2%, a difference of 0.040%), and Guatemalan (89.2%, a difference of 0.050%).
DemographicsRating | Rank1 or more Vehicles in Household
Immigrants from Armenia
31.8
/100
|
#195
Fair
89.4%
Crow
24.3
/100
|
#196
Fair
89.3%
Immigrants from Sweden
23.6
/100
|
#197
Fair
89.3%
Pennsylvania Germans
22.9
/100
|
#198
Fair
89.3%
Immigrants from Asia
22.8
/100
|
#199
Fair
89.3%
Central Americans
21.4
/100
|
#200
Fair
89.2%
Immigrants from Western Europe
20.5
/100
|
#201
Fair
89.2%
Iroquois
19.8
/100
|
#202
Poor
89.2%
Cambodians
18.9
/100
|
#203
Poor
89.2%
Romanians
18.2
/100
|
#204
Poor
89.2%
Guatemalans
17.8
/100
|
#205
Poor
89.2%
Apache
16.2
/100
|
#206
Poor
89.1%
Immigrants from Denmark
14.8
/100
|
#207
Poor
89.1%
Immigrants from Chile
14.4
/100
|
#208
Poor
89.1%
Immigrants from Italy
14.0
/100
|
#209
Poor
89.1%

Iroquois 1 or more Vehicles in Household Correlation Summary

MeasurementIroquois Data1 or more Vehicles in Household Data
Minimum0.054%83.1%
Maximum98.3%100.0%
Range98.3%16.9%
Mean17.3%94.2%
Median11.3%94.2%
Interquartile 25% (IQ1)5.4%91.8%
Interquartile 75% (IQ3)25.3%97.0%
Interquartile Range (IQR)19.9%5.2%
Standard Deviation (Sample)18.7%4.2%
Standard Deviation (Population)18.5%4.1%

Correlation Details

Iroquois PercentileSample Size1 or more Vehicles in Household
[
0.0%
-
0.5%
]
0.054%
203,080,35288.3%
[
0.5%
-
1.0%
]
0.65%
2,854,28790.0%
[
1.0%
-
1.5%
]
1.21%
581,97489.5%
[
1.5%
-
2.0%
]
1.73%
221,78194.0%
[
2.0%
-
2.5%
]
2.14%
295,75292.2%
[
2.5%
-
3.0%
]
2.61%
35,43795.7%
[
3.0%
-
3.5%
]
3.19%
53,41794.7%
[
3.5%
-
4.0%
]
3.67%
39,28993.8%
[
4.0%
-
4.5%
]
4.15%
11,47494.7%
[
4.5%
-
5.0%
]
4.82%
5,62293.1%
[
5.0%
-
5.5%
]
5.07%
2,21196.2%
[
5.5%
-
6.0%
]
5.76%
2,48195.1%
[
5.5%
-
6.0%
]
5.96%
10,56198.5%
[
6.5%
-
7.0%
]
6.56%
83998.1%
[
7.0%
-
7.5%
]
7.08%
1,56894.1%
[
7.5%
-
8.0%
]
7.72%
27292.5%
[
8.0%
-
8.5%
]
8.25%
1,34597.3%
[
8.0%
-
8.5%
]
8.43%
35688.4%
[
9.0%
-
9.5%
]
9.28%
6,18691.2%
[
9.5%
-
10.0%
]
9.67%
12,36396.6%
[
10.0%
-
10.5%
]
10.46%
4,36796.4%
[
11.0%
-
11.5%
]
11.11%
3688.9%
[
11.5%
-
12.0%
]
11.58%
1,09794.4%
[
11.5%
-
12.0%
]
11.84%
1,68191.7%
[
12.0%
-
12.5%
]
12.32%
2,20794.2%
[
12.5%
-
13.0%
]
12.90%
1,20292.7%
[
13.5%
-
14.0%
]
13.82%
2,07694.3%
[
15.0%
-
15.5%
]
15.37%
88596.8%
[
16.0%
-
16.5%
]
16.39%
1,03792.0%
[
18.5%
-
19.0%
]
18.85%
12,80583.1%
[
19.0%
-
19.5%
]
19.37%
50694.1%
[
23.0%
-
23.5%
]
23.26%
2,21896.4%
[
24.5%
-
25.0%
]
24.74%
2,91094.0%
[
25.5%
-
26.0%
]
25.91%
65687.5%
[
26.0%
-
26.5%
]
26.31%
1,60098.4%
[
26.5%
-
27.0%
]
26.83%
205100.0%
[
27.0%
-
27.5%
]
27.27%
132100.0%
[
28.0%
-
28.5%
]
28.26%
138100.0%
[
30.5%
-
31.0%
]
30.77%
117100.0%
[
38.0%
-
38.5%
]
38.12%
160100.0%
[
43.5%
-
44.0%
]
43.75%
128100.0%
[
53.5%
-
54.0%
]
53.93%
4,22286.1%
[
59.5%
-
60.0%
]
59.63%
3,66989.1%
[
98.0%
-
98.5%
]
98.31%
59100.0%