Inupiat GED/Equivalency
COMPARE
Inupiat
Select to Compare
GED/Equivalency
Inupiat GED/Equivalency
83.1%
GED/EQUIVALENCY
0.2/ 100
METRIC RATING
261st/ 347
METRIC RANK
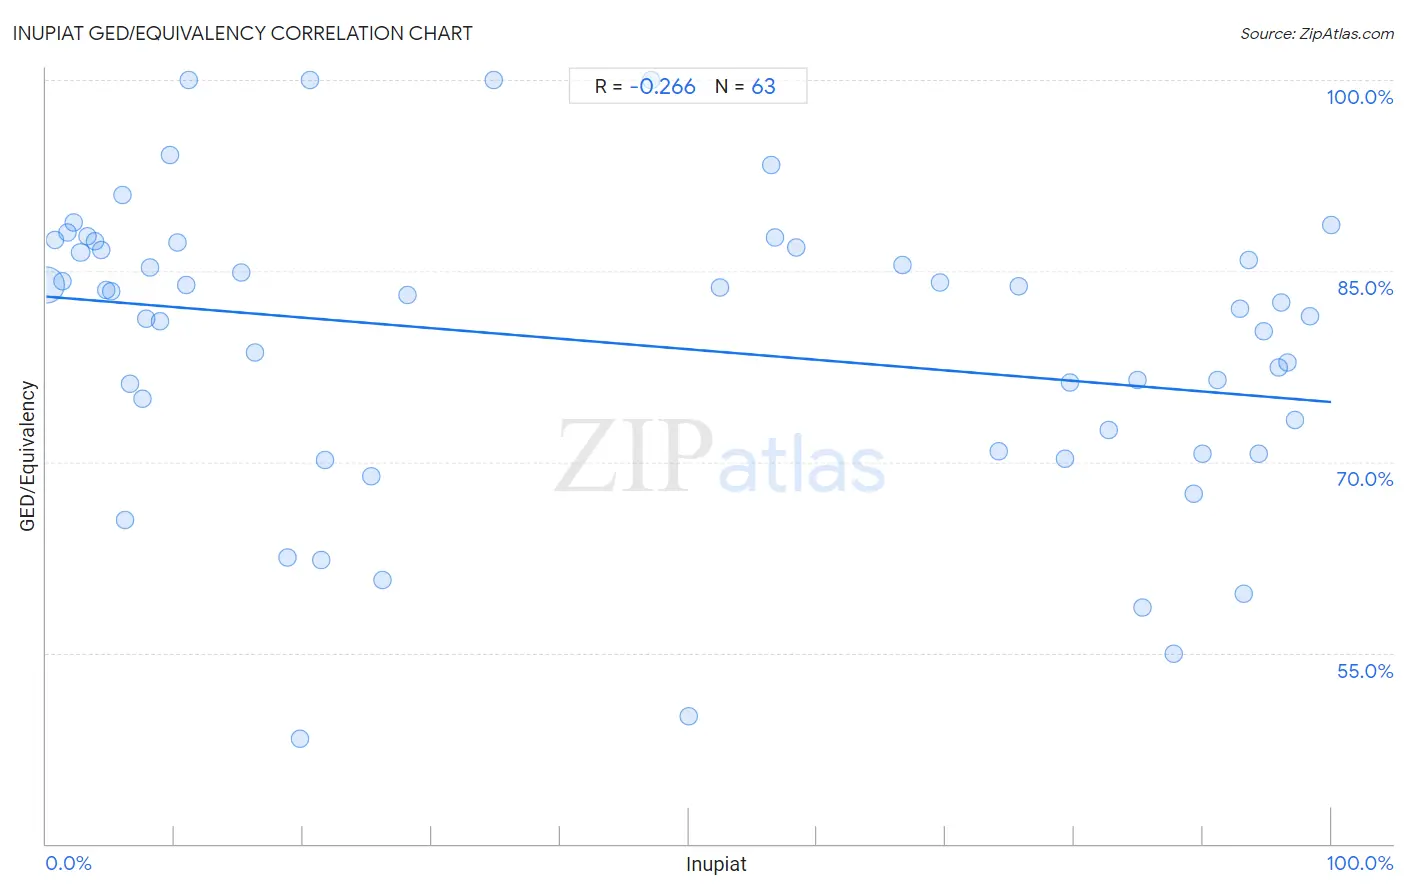
Inupiat GED/Equivalency Correlation Chart
The statistical analysis conducted on geographies consisting of 96,349,240 people shows a weak negative correlation between the proportion of Inupiat and percentage of population with at least ged/equivalency education in the United States with a correlation coefficient (R) of -0.266 and weighted average of 83.1%. On average, for every 1% (one percent) increase in Inupiat within a typical geography, there is a decrease of 0.083% in percentage of population with at least ged/equivalency education.
It is essential to understand that the correlation between the percentage of Inupiat and percentage of population with at least ged/equivalency education does not imply a direct cause-and-effect relationship. It remains uncertain whether the presence of Inupiat influences an upward or downward trend in the level of percentage of population with at least ged/equivalency education within an area, or if Inupiat simply ended up residing in those areas with higher or lower levels of percentage of population with at least ged/equivalency education due to other factors.
Demographics Similar to Inupiat by GED/Equivalency
In terms of ged/equivalency, the demographic groups most similar to Inupiat are Immigrants from Armenia (83.1%, a difference of 0.0%), Immigrants from Congo (83.1%, a difference of 0.010%), Bangladeshi (83.1%, a difference of 0.020%), West Indian (83.1%, a difference of 0.030%), and Kiowa (83.1%, a difference of 0.040%).
| Demographics | Rating | Rank | GED/Equivalency |
| Creek | 0.7 /100 | #254 | Tragic 83.6% |
| Colville | 0.5 /100 | #255 | Tragic 83.4% |
| Africans | 0.5 /100 | #256 | Tragic 83.4% |
| Jamaicans | 0.4 /100 | #257 | Tragic 83.3% |
| Malaysians | 0.4 /100 | #258 | Tragic 83.3% |
| Immigrants from Vietnam | 0.3 /100 | #259 | Tragic 83.2% |
| Choctaw | 0.3 /100 | #260 | Tragic 83.1% |
| Inupiat | 0.2 /100 | #261 | Tragic 83.1% |
| Immigrants from Armenia | 0.2 /100 | #262 | Tragic 83.1% |
| Immigrants from Congo | 0.2 /100 | #263 | Tragic 83.1% |
| Bangladeshis | 0.2 /100 | #264 | Tragic 83.1% |
| West Indians | 0.2 /100 | #265 | Tragic 83.1% |
| Kiowa | 0.2 /100 | #266 | Tragic 83.1% |
| Trinidadians and Tobagonians | 0.2 /100 | #267 | Tragic 83.0% |
| Immigrants from Burma/Myanmar | 0.2 /100 | #268 | Tragic 83.0% |
Inupiat GED/Equivalency Correlation Summary
| Measurement | Inupiat Data | GED/Equivalency Data |
| Minimum | 0.028% | 48.2% |
| Maximum | 100.0% | 100.0% |
| Range | 100.0% | 51.8% |
| Mean | 44.4% | 79.3% |
| Median | 28.1% | 82.5% |
| Interquartile 25% (IQ1) | 7.8% | 70.8% |
| Interquartile 75% (IQ3) | 85.3% | 86.8% |
| Interquartile Range (IQR) | 77.5% | 16.0% |
| Standard Deviation (Sample) | 37.5% | 11.7% |
| Standard Deviation (Population) | 37.2% | 11.6% |
Correlation Details
| Inupiat Percentile | Sample Size | GED/Equivalency |
[ 0.0% - 0.5% ] 0.028% | 94,681,717 | 83.9% |
[ 0.5% - 1.0% ] 0.70% | 432,401 | 87.5% |
[ 1.0% - 1.5% ] 1.25% | 320,421 | 84.2% |
[ 1.5% - 2.0% ] 1.64% | 100,478 | 88.0% |
[ 2.0% - 2.5% ] 2.17% | 456,675 | 88.8% |
[ 2.5% - 3.0% ] 2.67% | 170,010 | 86.4% |
[ 3.0% - 3.5% ] 3.19% | 32,728 | 87.7% |
[ 3.5% - 4.0% ] 3.75% | 70,281 | 87.3% |
[ 4.0% - 4.5% ] 4.24% | 10,052 | 86.7% |
[ 4.5% - 5.0% ] 4.69% | 3,070 | 83.5% |
[ 5.0% - 5.5% ] 5.06% | 7,328 | 83.4% |
[ 5.5% - 6.0% ] 5.90% | 983 | 91.0% |
[ 6.0% - 6.5% ] 6.11% | 2,372 | 65.4% |
[ 6.5% - 7.0% ] 6.51% | 2,858 | 76.2% |
[ 7.0% - 7.5% ] 7.46% | 134 | 74.9% |
[ 7.5% - 8.0% ] 7.77% | 927 | 81.3% |
[ 8.0% - 8.5% ] 8.05% | 584 | 85.3% |
[ 8.5% - 9.0% ] 8.82% | 499 | 81.0% |
[ 9.5% - 10.0% ] 9.60% | 4,229 | 94.1% |
[ 10.0% - 10.5% ] 10.25% | 478 | 87.3% |
[ 10.5% - 11.0% ] 10.92% | 119 | 83.9% |
[ 11.0% - 11.5% ] 11.11% | 9 | 100.0% |
[ 15.0% - 15.5% ] 15.20% | 329 | 84.8% |
[ 16.0% - 16.5% ] 16.23% | 616 | 78.6% |
[ 18.5% - 19.0% ] 18.75% | 16 | 62.5% |
[ 19.5% - 20.0% ] 19.76% | 1,640 | 48.2% |
[ 20.5% - 21.0% ] 20.51% | 78 | 100.0% |
[ 21.0% - 21.5% ] 21.38% | 1,113 | 62.3% |
[ 21.5% - 22.0% ] 21.74% | 69 | 70.2% |
[ 25.0% - 25.5% ] 25.26% | 95 | 68.9% |
[ 26.0% - 26.5% ] 26.16% | 692 | 60.8% |
[ 28.0% - 28.5% ] 28.09% | 89 | 83.1% |
[ 34.5% - 35.0% ] 34.78% | 46 | 100.0% |
[ 47.0% - 47.5% ] 47.06% | 51 | 100.0% |
[ 50.0% - 50.5% ] 50.00% | 60 | 50.0% |
[ 52.0% - 52.5% ] 52.38% | 9,755 | 83.7% |
[ 56.0% - 56.5% ] 56.38% | 752 | 93.3% |
[ 56.5% - 57.0% ] 56.68% | 4,453 | 87.6% |
[ 58.0% - 58.5% ] 58.36% | 4,150 | 86.8% |
[ 66.5% - 67.0% ] 66.61% | 3,255 | 85.4% |
[ 69.5% - 70.0% ] 69.59% | 3,088 | 84.1% |
[ 74.0% - 74.5% ] 74.11% | 1,128 | 70.8% |
[ 75.5% - 76.0% ] 75.68% | 1,242 | 83.8% |
[ 79.0% - 79.5% ] 79.28% | 444 | 70.3% |
[ 79.5% - 80.0% ] 79.68% | 630 | 76.3% |
[ 82.5% - 83.0% ] 82.67% | 554 | 72.5% |
[ 84.5% - 85.0% ] 84.88% | 344 | 76.5% |
[ 85.0% - 85.5% ] 85.30% | 558 | 58.6% |
[ 87.5% - 88.0% ] 87.79% | 1,114 | 55.0% |
[ 89.0% - 89.5% ] 89.30% | 1,308 | 67.4% |
[ 89.5% - 90.0% ] 89.95% | 378 | 70.7% |
[ 91.0% - 91.5% ] 91.10% | 1,686 | 76.5% |
[ 92.5% - 93.0% ] 92.91% | 846 | 82.0% |
[ 93.0% - 93.5% ] 93.23% | 266 | 59.6% |
[ 93.5% - 94.0% ] 93.57% | 809 | 85.9% |
[ 94.0% - 94.5% ] 94.31% | 1,652 | 70.6% |
[ 94.5% - 95.0% ] 94.72% | 1,136 | 80.2% |
[ 95.5% - 96.0% ] 95.96% | 1,288 | 77.4% |
[ 96.0% - 96.5% ] 96.08% | 1,072 | 82.5% |
[ 96.5% - 97.0% ] 96.60% | 588 | 77.8% |
[ 97.0% - 97.5% ] 97.19% | 2,138 | 73.3% |
[ 98.0% - 98.5% ] 98.30% | 824 | 81.4% |
[ 99.5% - 100.0% ] 100.00% | 535 | 88.7% |