Inupiat 4 or more Vehicles in Household
COMPARE
Inupiat
Select to Compare
4 or more Vehicles in Household
Inupiat 4 or more Vehicles in Household
6.2%
4+ VEHICLES AVAILABLE
30.7/ 100
METRIC RATING
191st/ 347
METRIC RANK
Inupiat 4 or more Vehicles in Household Correlation Chart
The statistical analysis conducted on geographies consisting of 96,224,562 people shows a significant negative correlation between the proportion of Inupiat and percentage of households with 4 or more vehicles available in the United States with a correlation coefficient (R) of -0.639 and weighted average of 6.2%. On average, for every 1% (one percent) increase in Inupiat within a typical geography, there is a decrease of 0.14% in percentage of households with 4 or more vehicles available.
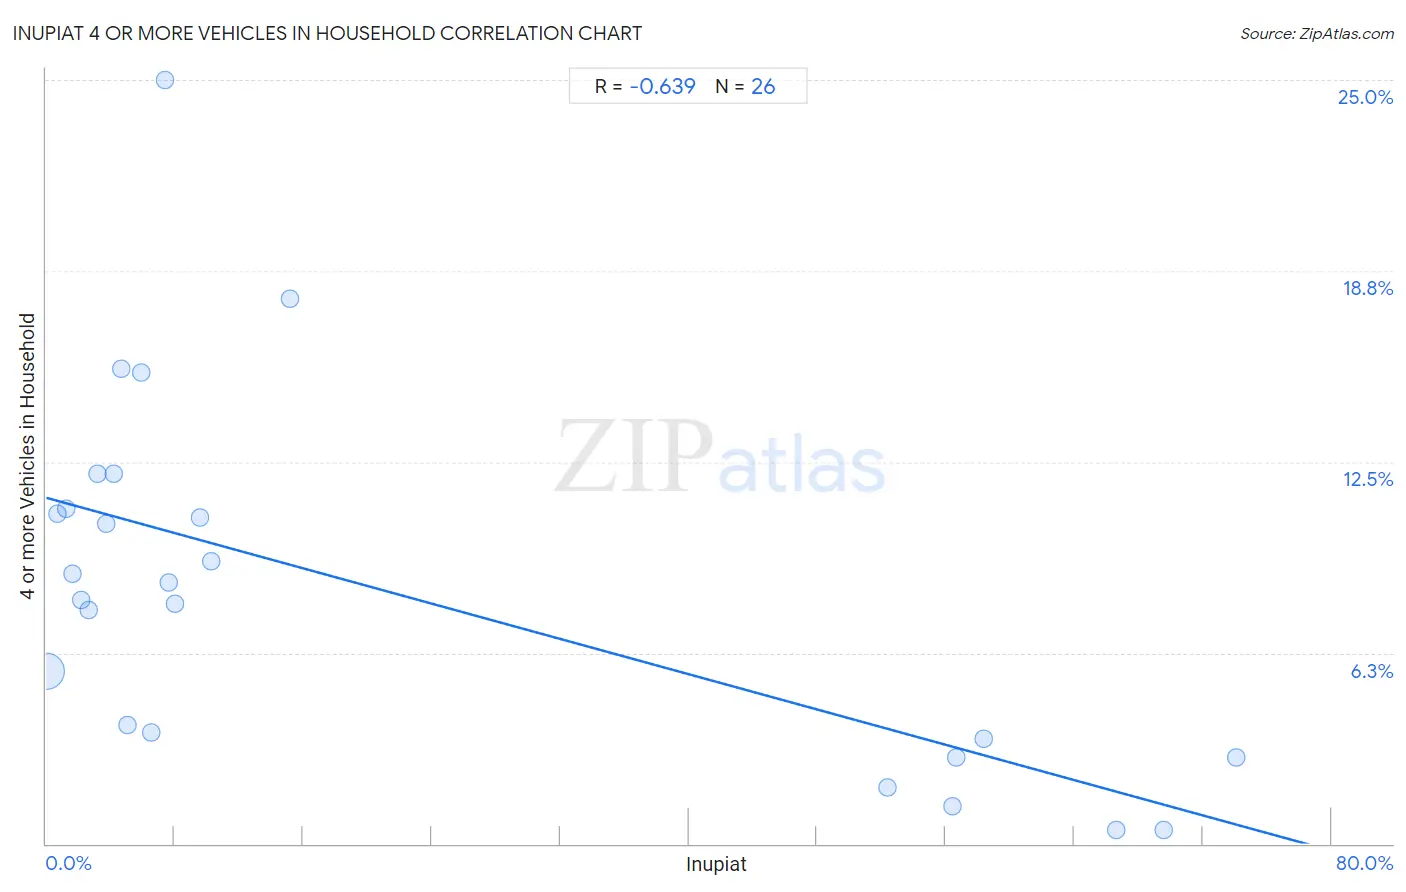
It is essential to understand that the correlation between the percentage of Inupiat and percentage of households with 4 or more vehicles available does not imply a direct cause-and-effect relationship. It remains uncertain whether the presence of Inupiat influences an upward or downward trend in the level of percentage of households with 4 or more vehicles available within an area, or if Inupiat simply ended up residing in those areas with higher or lower levels of percentage of households with 4 or more vehicles available due to other factors.
Demographics Similar to Inupiat by 4 or more Vehicles in Household
In terms of 4 or more vehicles in household, the demographic groups most similar to Inupiat are Romanian (6.2%, a difference of 0.010%), South African (6.2%, a difference of 0.18%), Immigrants from Eastern Asia (6.2%, a difference of 0.30%), Immigrants from Kuwait (6.2%, a difference of 0.35%), and Kiowa (6.2%, a difference of 0.47%).
| Demographics | Rating | Rank | 4 or more Vehicles in Household |
| Iraqis | 37.3 /100 | #184 | Fair 6.2% |
| Thais | 36.9 /100 | #185 | Fair 6.2% |
| Immigrants from Northern Europe | 36.8 /100 | #186 | Fair 6.2% |
| Immigrants from South Africa | 35.4 /100 | #187 | Fair 6.2% |
| Kiowa | 34.7 /100 | #188 | Fair 6.2% |
| Immigrants from Eastern Asia | 33.3 /100 | #189 | Fair 6.2% |
| South Africans | 32.2 /100 | #190 | Fair 6.2% |
| Inupiat | 30.7 /100 | #191 | Fair 6.2% |
| Romanians | 30.7 /100 | #192 | Fair 6.2% |
| Immigrants from Kuwait | 28.0 /100 | #193 | Fair 6.2% |
| Immigrants from Sweden | 27.0 /100 | #194 | Fair 6.2% |
| Argentineans | 27.0 /100 | #195 | Fair 6.2% |
| Tsimshian | 26.4 /100 | #196 | Fair 6.2% |
| Immigrants from Sri Lanka | 23.7 /100 | #197 | Fair 6.1% |
| Immigrants from Portugal | 22.3 /100 | #198 | Fair 6.1% |
Inupiat 4 or more Vehicles in Household Correlation Summary
| Measurement | Inupiat Data | 4 or more Vehicles in Household Data |
| Minimum | 0.028% | 0.47% |
| Maximum | 74.1% | 25.0% |
| Range | 74.1% | 24.5% |
| Mean | 20.5% | 8.4% |
| Median | 7.0% | 8.3% |
| Interquartile 25% (IQ1) | 3.2% | 3.4% |
| Interquartile 75% (IQ3) | 52.4% | 11.0% |
| Interquartile Range (IQR) | 49.2% | 7.5% |
| Standard Deviation (Sample) | 26.2% | 5.9% |
| Standard Deviation (Population) | 25.7% | 5.8% |
Correlation Details
| Inupiat Percentile | Sample Size | 4 or more Vehicles in Household |
[ 0.0% - 0.5% ] 0.028% | 94,630,244 | 5.6% |
[ 0.5% - 1.0% ] 0.70% | 419,799 | 10.8% |
[ 1.0% - 1.5% ] 1.25% | 316,565 | 11.0% |
[ 1.5% - 2.0% ] 1.64% | 93,451 | 8.8% |
[ 2.0% - 2.5% ] 2.17% | 448,264 | 8.0% |
[ 2.5% - 3.0% ] 2.67% | 164,949 | 7.7% |
[ 3.0% - 3.5% ] 3.18% | 30,482 | 12.1% |
[ 3.5% - 4.0% ] 3.75% | 67,998 | 10.5% |
[ 4.0% - 4.5% ] 4.18% | 7,053 | 12.1% |
[ 4.5% - 5.0% ] 4.69% | 3,070 | 15.5% |
[ 5.0% - 5.5% ] 5.06% | 6,464 | 3.9% |
[ 5.5% - 6.0% ] 5.93% | 843 | 15.4% |
[ 6.5% - 7.0% ] 6.50% | 2,768 | 3.6% |
[ 7.0% - 7.5% ] 7.41% | 54 | 25.0% |
[ 7.5% - 8.0% ] 7.62% | 407 | 8.5% |
[ 8.0% - 8.5% ] 8.05% | 584 | 7.9% |
[ 9.5% - 10.0% ] 9.60% | 4,179 | 10.7% |
[ 10.0% - 10.5% ] 10.25% | 478 | 9.2% |
[ 15.0% - 15.5% ] 15.20% | 329 | 17.9% |
[ 52.0% - 52.5% ] 52.38% | 9,755 | 1.8% |
[ 56.0% - 56.5% ] 56.38% | 752 | 1.2% |
[ 56.5% - 57.0% ] 56.68% | 4,453 | 2.8% |
[ 58.0% - 58.5% ] 58.36% | 4,150 | 3.4% |
[ 66.5% - 67.0% ] 66.61% | 3,255 | 0.47% |
[ 69.5% - 70.0% ] 69.59% | 3,088 | 0.47% |
[ 74.0% - 74.5% ] 74.11% | 1,128 | 2.8% |