Inupiat Married-Couple Family Poverty

COMPARE

Inupiat
Race
Ancestry
AfghanAfricanAlaska NativeAlaskan AthabascanAlbanianAleutAlsatianAmericanApacheArabArapahoArgentineanArmenianAssyrian/Chaldean/SyriacAustralianAustrianBahamianBangladeshiBarbadianBasqueBelgianBelizeanBermudanBhutaneseBlackfeetBolivianBrazilianBritishBritish West IndianBulgarianBurmeseCajunCambodianCanadianCape VerdeanCarpatho RusynCelticCentral AmericanCentral American IndianCherokeeCheyenneChickasawChileanChineseChippewaChoctawColombianColvilleComancheCosta RicanCreeCreekCroatianCrowCubanCypriotCzechCzechoslovakianDanishDelawareDominicanDutchDutch West IndianEastern EuropeanEcuadorianEgyptianEnglishEstonianEthiopianEuropeanFijianFilipinoFinnishFrenchFrench American IndianFrench CanadianGermanGerman RussianGhanaianGreekGuamanian/ChamorroGuatemalanGuyaneseHaitianHmongHonduranHopiHoumaHungarianIcelanderIndian (Asian)IndonesianInupiatIranianIraqiIrishIroquoisIsraeliItalianJamaicanJapaneseJordanianKenyanKiowaKoreanLaotianLatvianLebaneseLiberianLithuanianLumbeeLuxembourgerMacedonianMalaysianMalteseMarshalleseMenomineeMexicanMexican American IndianMongolianMoroccanNative HawaiianNavajoNepaleseNew ZealanderNicaraguanNigerianNorthern EuropeanNorwegianOkinawanOsageOttawaPaiutePakistaniPalestinianPanamanianParaguayanPennsylvania GermanPeruvianPimaPolishPortuguesePotawatomiPuebloPuerto RicanPuget Sound SalishRomanianRussianSalvadoranSamoanScandinavianScotch-IrishScottishSeminoleSenegaleseSerbianShoshoneSierra LeoneanSiouxSlavicSlovakSloveneSomaliSouth AfricanSouth AmericanSouth American IndianSoviet UnionSpaniardSpanishSpanish AmericanSpanish American IndianSri LankanSubsaharan AfricanSudaneseSwedishSwissSyrianTaiwaneseThaiTlingit-HaidaTohono O'OdhamTonganTrinidadian and TobagonianTsimshianTurkishU.S. Virgin IslanderUgandanUkrainianUruguayanUteVenezuelanVietnameseWelshWest IndianYakamaYaquiYugoslavianYumanYup'ikZimbabwean
Immigration
NonimmigrantsImmigrantsAfghanistanAfricaAlbaniaArgentinaArmeniaAsiaAustraliaAustriaBahamasBangladeshBarbadosBelarusBelgiumBelizeBoliviaBosnia and HerzegovinaBrazilBulgariaBurma/MyanmarCabo VerdeCambodiaCameroonCanadaCaribbeanCentral AmericaChileChinaColombiaCongoCosta RicaCroatiaCubaCzechoslovakiaDenmarkDominicaDominican RepublicEastern AfricaEastern AsiaEastern EuropeEcuadorEgyptEl SalvadorEnglandEritreaEthiopiaEuropeFijiFranceGermanyGhanaGreeceGrenadaGuatemalaGuyanaHaitiHondurasHong KongHungaryIndiaIndonesiaIranIraqIrelandIsraelItalyJamaicaJapanJordanKazakhstanKenyaKoreaKuwaitLaosLatin AmericaLatviaLebanonLiberiaLithuaniaMalaysiaMexicoMicronesiaMiddle AfricaMoldovaMoroccoNepalNetherlandsNicaraguaNigeriaNorth AmericaNorth MacedoniaNorthern AfricaNorthern EuropeNorwayOceaniaPakistanPanamaPeruPhilippinesPolandPortugalRomaniaRussiaSaudi ArabiaScotlandSenegalSerbiaSierra LeoneSingaporeSomaliaSouth AfricaSouth AmericaSouth Central AsiaSouth Eastern AsiaSouthern EuropeSpainSri LankaSt. Vincent and the GrenadinesSudanSwedenSwitzerlandSyriaTaiwanThailandTrinidad and TobagoTurkeyUgandaUkraineUruguayUzbekistanVenezuelaVietnamWest IndiesWestern AfricaWestern AsiaWestern EuropeYemenZaireZimbabweAzores
Select to Compare
Race
Ancestry
AfghanAfricanAlaska NativeAlaskan AthabascanAlbanianAleutAlsatianAmericanApacheArabArapahoArgentineanArmenianAssyrian/Chaldean/SyriacAustralianAustrianBahamianBangladeshiBarbadianBasqueBelgianBelizeanBermudanBhutaneseBlackfeetBolivianBrazilianBritishBritish West IndianBulgarianBurmeseCajunCambodianCanadianCape VerdeanCarpatho RusynCelticCentral AmericanCentral American IndianCherokeeCheyenneChickasawChileanChineseChippewaChoctawColombianColvilleComancheCosta RicanCreeCreekCroatianCrowCubanCypriotCzechCzechoslovakianDanishDelawareDominicanDutchDutch West IndianEastern EuropeanEcuadorianEgyptianEnglishEstonianEthiopianEuropeanFijianFilipinoFinnishFrenchFrench American IndianFrench CanadianGermanGerman RussianGhanaianGreekGuamanian/ChamorroGuatemalanGuyaneseHaitianHmongHonduranHopiHoumaHungarianIcelanderIndian (Asian)IndonesianIranianIraqiIrishIroquoisIsraeliItalianJamaicanJapaneseJordanianKenyanKiowaKoreanLaotianLatvianLebaneseLiberianLithuanianLumbeeLuxembourgerMacedonianMalaysianMalteseMarshalleseMenomineeMexicanMexican American IndianMongolianMoroccanNative HawaiianNavajoNepaleseNew ZealanderNicaraguanNigerianNorthern EuropeanNorwegianOkinawanOsageOttawaPaiutePakistaniPalestinianPanamanianParaguayanPennsylvania GermanPeruvianPimaPolishPortuguesePotawatomiPuebloPuerto RicanPuget Sound SalishRomanianRussianSalvadoranSamoanScandinavianScotch-IrishScottishSeminoleSenegaleseSerbianShoshoneSierra LeoneanSiouxSlavicSlovakSloveneSomaliSouth AfricanSouth AmericanSouth American IndianSoviet UnionSpaniardSpanishSpanish AmericanSpanish American IndianSri LankanSubsaharan AfricanSudaneseSwedishSwissSyrianTaiwaneseThaiTlingit-HaidaTohono O'OdhamTonganTrinidadian and TobagonianTsimshianTurkishU.S. Virgin IslanderUgandanUkrainianUruguayanUteVenezuelanVietnameseWelshWest IndianYakamaYaquiYugoslavianYumanYup'ikZimbabwean
Immigration
NonimmigrantsImmigrantsAfghanistanAfricaAlbaniaArgentinaArmeniaAsiaAustraliaAustriaBahamasBangladeshBarbadosBelarusBelgiumBelizeBoliviaBosnia and HerzegovinaBrazilBulgariaBurma/MyanmarCabo VerdeCambodiaCameroonCanadaCaribbeanCentral AmericaChileChinaColombiaCongoCosta RicaCroatiaCubaCzechoslovakiaDenmarkDominicaDominican RepublicEastern AfricaEastern AsiaEastern EuropeEcuadorEgyptEl SalvadorEnglandEritreaEthiopiaEuropeFijiFranceGermanyGhanaGreeceGrenadaGuatemalaGuyanaHaitiHondurasHong KongHungaryIndiaIndonesiaIranIraqIrelandIsraelItalyJamaicaJapanJordanKazakhstanKenyaKoreaKuwaitLaosLatin AmericaLatviaLebanonLiberiaLithuaniaMalaysiaMexicoMicronesiaMiddle AfricaMoldovaMoroccoNepalNetherlandsNicaraguaNigeriaNorth AmericaNorth MacedoniaNorthern AfricaNorthern EuropeNorwayOceaniaPakistanPanamaPeruPhilippinesPolandPortugalRomaniaRussiaSaudi ArabiaScotlandSenegalSerbiaSierra LeoneSingaporeSomaliaSouth AfricaSouth AmericaSouth Central AsiaSouth Eastern AsiaSouthern EuropeSpainSri LankaSt. Vincent and the GrenadinesSudanSwedenSwitzerlandSyriaTaiwanThailandTrinidad and TobagoTurkeyUgandaUkraineUruguayUzbekistanVenezuelaVietnamWest IndiesWestern AfricaWestern AsiaWestern EuropeYemenZaireZimbabweAzores
Married-Couple Family Poverty
Income
Poverty
Unemployment
Labor Participation
Family Structure
Vehicle Availability
Education Level
Disability

Inupiat Married-Couple Family Poverty
Tragic

7.1%
POVERTY | MARRIED-COUPLE FAMILIES
0.0/ 100
METRIC RATING
315th/ 347
METRIC RANK

Inupiat Married-Couple Family Poverty Correlation Chart

The statistical analysis conducted on geographies consisting of 96,004,773 people shows a slight positive correlation between the proportion of Inupiat and poverty level among married-couple families in the United States with a correlation coefficient (R) of 0.061 and weighted average of 7.1%. On average, for every 1% (one percent) increase in Inupiat within a typical geography, there is an increase of 0.020% in poverty level among married-couple families.
Inupiat Married-Couple Family Poverty
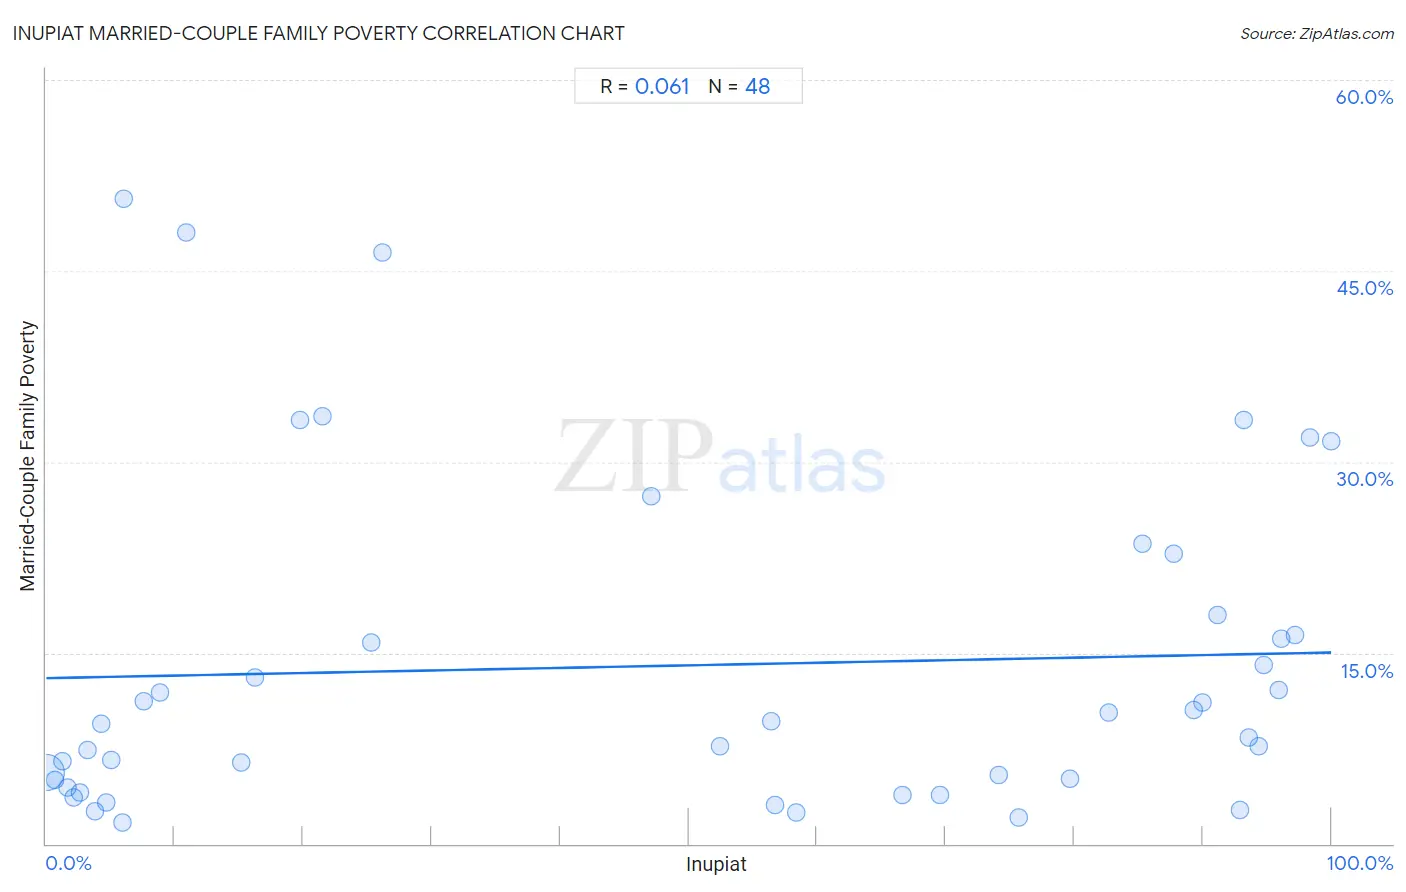
It is essential to understand that the correlation between the percentage of Inupiat and poverty level among married-couple families does not imply a direct cause-and-effect relationship. It remains uncertain whether the presence of Inupiat influences an upward or downward trend in the level of poverty level among married-couple families within an area, or if Inupiat simply ended up residing in those areas with higher or lower levels of poverty level among married-couple families due to other factors.

Demographics Similar to Inupiat by Married-Couple Family Poverty

In terms of married-couple family poverty, the demographic groups most similar to Inupiat are Honduran (7.2%, a difference of 0.15%), British West Indian (7.1%, a difference of 0.24%), Mexican (7.2%, a difference of 0.47%), Immigrants from St. Vincent and the Grenadines (7.1%, a difference of 0.54%), and Immigrants from Guatemala (7.2%, a difference of 0.63%).
DemographicsRating | RankMarried-Couple Family Poverty
Spanish American Indians
0.0
/100
|
#308
Tragic
7.1%
Hopi
0.0
/100
|
#309
Tragic
7.1%
Immigrants from Nicaragua
0.0
/100
|
#310
Tragic
7.1%
Immigrants from Dominica
0.0
/100
|
#311
Tragic
7.1%
Immigrants from Armenia
0.0
/100
|
#312
Tragic
7.1%
Immigrants from St. Vincent and the Grenadines
0.0
/100
|
#313
Tragic
7.1%
British West Indians
0.0
/100
|
#314
Tragic
7.1%
Inupiat
0.0
/100
|
#315
Tragic
7.1%
Hondurans
0.0
/100
|
#316
Tragic
7.2%
Mexicans
0.0
/100
|
#317
Tragic
7.2%
Immigrants from Guatemala
0.0
/100
|
#318
Tragic
7.2%
Immigrants from Latin America
0.0
/100
|
#319
Tragic
7.2%
Immigrants from Grenada
0.0
/100
|
#320
Tragic
7.3%
Immigrants from Caribbean
0.0
/100
|
#321
Tragic
7.3%
Immigrants from Honduras
0.0
/100
|
#322
Tragic
7.3%

Inupiat Married-Couple Family Poverty Correlation Summary

MeasurementInupiat DataMarried-Couple Family Poverty Data
Minimum0.028%1.6%
Maximum100.0%50.7%
Range100.0%49.0%
Mean48.2%14.0%
Median54.4%9.6%
Interquartile 25% (IQ1)6.0%4.7%
Interquartile 75% (IQ3)89.6%17.2%
Interquartile Range (IQR)83.6%12.5%
Standard Deviation (Sample)38.9%12.9%
Standard Deviation (Population)38.5%12.8%

Correlation Details

Inupiat PercentileSample SizeMarried-Couple Family Poverty
[
0.0%
-
0.5%
]
0.028%
94,435,5885.6%
[
0.5%
-
1.0%
]
0.70%
396,1055.0%
[
1.0%
-
1.5%
]
1.25%
316,6736.5%
[
1.5%
-
2.0%
]
1.64%
90,6564.5%
[
2.0%
-
2.5%
]
2.17%
448,3863.6%
[
2.5%
-
3.0%
]
2.67%
167,1654.0%
[
3.0%
-
3.5%
]
3.17%
17,9317.4%
[
3.5%
-
4.0%
]
3.76%
61,6392.5%
[
4.0%
-
4.5%
]
4.25%
9,2299.5%
[
4.5%
-
5.0%
]
4.63%
2,1593.2%
[
5.0%
-
5.5%
]
5.06%
7,3286.6%
[
5.5%
-
6.0%
]
5.93%
8431.6%
[
6.0%
-
6.5%
]
6.07%
1,84450.7%
[
7.5%
-
8.0%
]
7.62%
40711.2%
[
8.5%
-
9.0%
]
8.85%
45211.9%
[
10.5%
-
11.0%
]
10.92%
11948.0%
[
15.0%
-
15.5%
]
15.20%
3296.4%
[
16.0%
-
16.5%
]
16.23%
61613.0%
[
19.5%
-
20.0%
]
19.76%
1,64033.3%
[
21.0%
-
21.5%
]
21.47%
84333.6%
[
25.0%
-
25.5%
]
25.26%
9515.8%
[
26.0%
-
26.5%
]
26.16%
69246.4%
[
47.0%
-
47.5%
]
47.06%
5127.3%
[
52.0%
-
52.5%
]
52.38%
9,7557.7%
[
56.0%
-
56.5%
]
56.38%
7529.6%
[
56.5%
-
57.0%
]
56.68%
4,4533.0%
[
58.0%
-
58.5%
]
58.36%
4,1502.4%
[
66.5%
-
67.0%
]
66.61%
3,2553.8%
[
69.5%
-
70.0%
]
69.59%
3,0883.8%
[
74.0%
-
74.5%
]
74.11%
1,1285.4%
[
75.5%
-
76.0%
]
75.68%
1,2422.1%
[
79.5%
-
80.0%
]
79.68%
6305.1%
[
82.5%
-
83.0%
]
82.67%
55410.3%
[
85.0%
-
85.5%
]
85.30%
55823.5%
[
87.5%
-
88.0%
]
87.79%
1,11422.8%
[
89.0%
-
89.5%
]
89.30%
1,30810.5%
[
89.5%
-
90.0%
]
89.95%
37811.1%
[
91.0%
-
91.5%
]
91.10%
1,68618.0%
[
92.5%
-
93.0%
]
92.91%
8462.6%
[
93.0%
-
93.5%
]
93.23%
26633.3%
[
93.5%
-
94.0%
]
93.59%
6248.3%
[
94.0%
-
94.5%
]
94.40%
1,2507.7%
[
94.5%
-
95.0%
]
94.72%
1,13614.0%
[
95.5%
-
96.0%
]
95.96%
1,28812.1%
[
96.0%
-
96.5%
]
96.08%
1,07216.1%
[
97.0%
-
97.5%
]
97.19%
2,13816.4%
[
98.0%
-
98.5%
]
98.30%
82432.0%
[
99.5%
-
100.0%
]
100.00%
48831.6%