Inupiat 1 or more Vehicles in Household
COMPARE
Inupiat
Select to Compare
1 or more Vehicles in Household
Inupiat 1 or more Vehicles in Household
71.5%
1+ VEHICLES AVAILABLE
0.0/ 100
METRIC RATING
338th/ 347
METRIC RANK
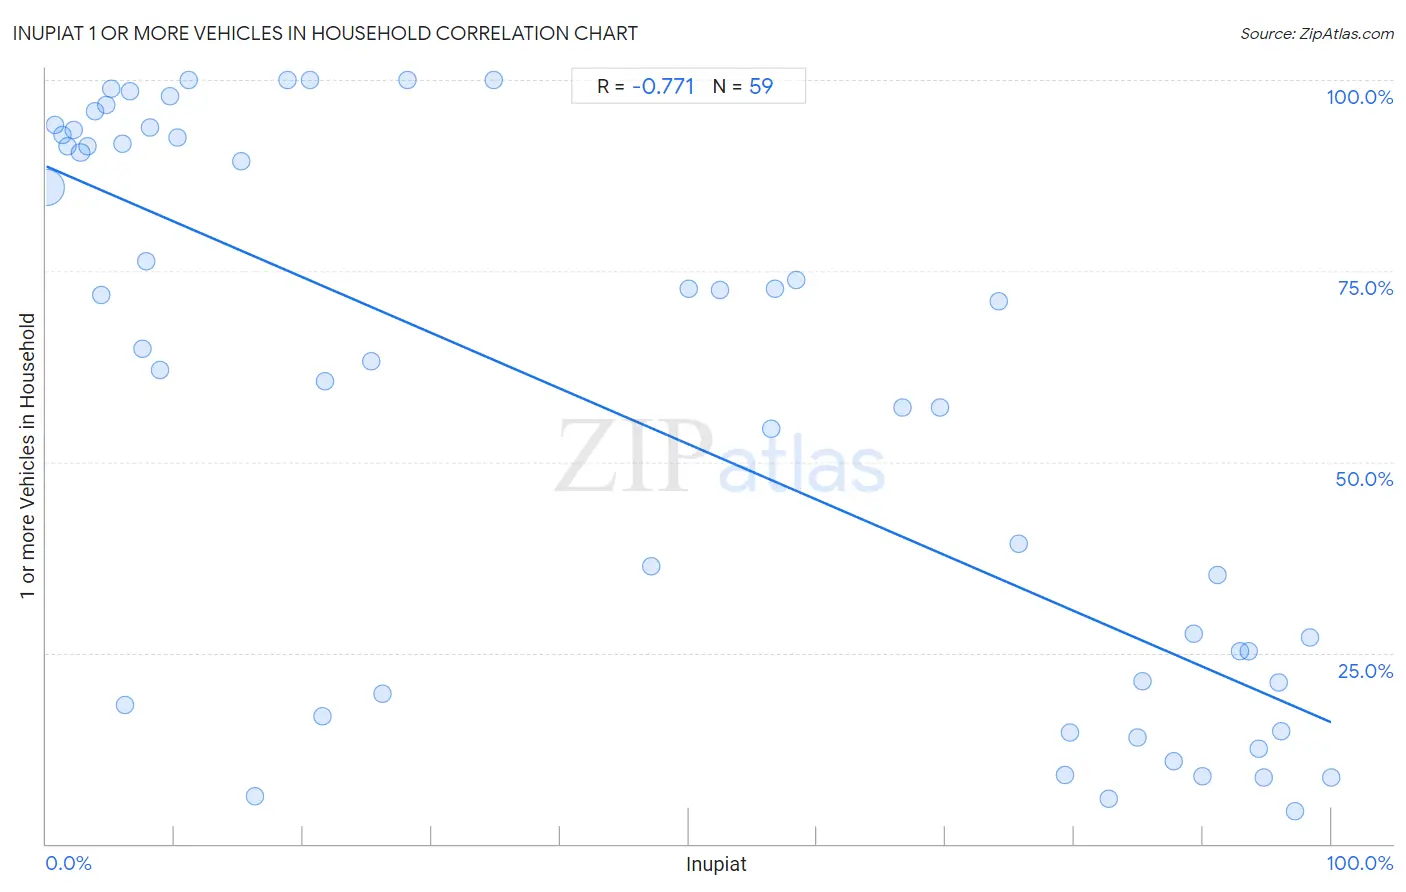
Inupiat 1 or more Vehicles in Household Correlation Chart
The statistical analysis conducted on geographies consisting of 96,318,712 people shows a strong negative correlation between the proportion of Inupiat and percentage of households with 1 or more vehicles available in the United States with a correlation coefficient (R) of -0.771 and weighted average of 71.5%. On average, for every 1% (one percent) increase in Inupiat within a typical geography, there is a decrease of 0.73% in percentage of households with 1 or more vehicles available.
It is essential to understand that the correlation between the percentage of Inupiat and percentage of households with 1 or more vehicles available does not imply a direct cause-and-effect relationship. It remains uncertain whether the presence of Inupiat influences an upward or downward trend in the level of percentage of households with 1 or more vehicles available within an area, or if Inupiat simply ended up residing in those areas with higher or lower levels of percentage of households with 1 or more vehicles available due to other factors.
Demographics Similar to Inupiat by 1 or more Vehicles in Household
In terms of 1 or more vehicles in household, the demographic groups most similar to Inupiat are Guyanese (70.8%, a difference of 1.0%), Dominican (70.7%, a difference of 1.2%), Immigrants from Barbados (70.6%, a difference of 1.3%), Immigrants from Guyana (70.6%, a difference of 1.4%), and British West Indian (70.4%, a difference of 1.7%).
| Demographics | Rating | Rank | 1 or more Vehicles in Household |
| West Indians | 0.0 /100 | #331 | Tragic 76.4% |
| Trinidadians and Tobagonians | 0.0 /100 | #332 | Tragic 76.3% |
| Immigrants from Ecuador | 0.0 /100 | #333 | Tragic 76.2% |
| Immigrants from Bangladesh | 0.0 /100 | #334 | Tragic 74.3% |
| Barbadians | 0.0 /100 | #335 | Tragic 74.0% |
| Vietnamese | 0.0 /100 | #336 | Tragic 73.8% |
| Immigrants from Uzbekistan | 0.0 /100 | #337 | Tragic 73.4% |
| Inupiat | 0.0 /100 | #338 | Tragic 71.5% |
| Guyanese | 0.0 /100 | #339 | Tragic 70.8% |
| Dominicans | 0.0 /100 | #340 | Tragic 70.7% |
| Immigrants from Barbados | 0.0 /100 | #341 | Tragic 70.6% |
| Immigrants from Guyana | 0.0 /100 | #342 | Tragic 70.6% |
| British West Indians | 0.0 /100 | #343 | Tragic 70.4% |
| Immigrants from Dominican Republic | 0.0 /100 | #344 | Tragic 68.6% |
| Immigrants from St. Vincent and the Grenadines | 0.0 /100 | #345 | Tragic 64.7% |
Inupiat 1 or more Vehicles in Household Correlation Summary
| Measurement | Inupiat Data | 1 or more Vehicles in Household Data |
| Minimum | 0.028% | 4.2% |
| Maximum | 100.0% | 100.0% |
| Range | 100.0% | 95.8% |
| Mean | 43.7% | 56.9% |
| Median | 28.1% | 63.2% |
| Interquartile 25% (IQ1) | 7.5% | 19.7% |
| Interquartile 75% (IQ3) | 84.9% | 92.5% |
| Interquartile Range (IQR) | 77.4% | 72.8% |
| Standard Deviation (Sample) | 37.2% | 35.1% |
| Standard Deviation (Population) | 36.9% | 34.8% |
Correlation Details
| Inupiat Percentile | Sample Size | 1 or more Vehicles in Household |
[ 0.0% - 0.5% ] 0.028% | 94,664,840 | 86.0% |
[ 0.5% - 1.0% ] 0.70% | 428,591 | 94.2% |
[ 1.0% - 1.5% ] 1.25% | 320,421 | 92.8% |
[ 1.5% - 2.0% ] 1.64% | 98,170 | 91.3% |
[ 2.0% - 2.5% ] 2.17% | 453,266 | 93.4% |
[ 2.5% - 3.0% ] 2.67% | 170,010 | 90.5% |
[ 3.0% - 3.5% ] 3.19% | 32,728 | 91.3% |
[ 3.5% - 4.0% ] 3.75% | 70,281 | 95.8% |
[ 4.0% - 4.5% ] 4.24% | 10,052 | 71.9% |
[ 4.5% - 5.0% ] 4.69% | 3,070 | 96.8% |
[ 5.0% - 5.5% ] 5.06% | 6,464 | 98.8% |
[ 5.5% - 6.0% ] 5.93% | 843 | 91.6% |
[ 6.0% - 6.5% ] 6.10% | 2,182 | 18.1% |
[ 6.5% - 7.0% ] 6.51% | 2,858 | 98.6% |
[ 7.0% - 7.5% ] 7.46% | 134 | 64.9% |
[ 7.5% - 8.0% ] 7.77% | 927 | 76.2% |
[ 8.0% - 8.5% ] 8.05% | 584 | 93.8% |
[ 8.5% - 9.0% ] 8.82% | 499 | 62.1% |
[ 9.5% - 10.0% ] 9.60% | 4,229 | 97.8% |
[ 10.0% - 10.5% ] 10.25% | 478 | 92.5% |
[ 11.0% - 11.5% ] 11.11% | 9 | 100.0% |
[ 15.0% - 15.5% ] 15.20% | 329 | 89.3% |
[ 16.0% - 16.5% ] 16.23% | 616 | 6.2% |
[ 18.5% - 19.0% ] 18.75% | 16 | 100.0% |
[ 20.5% - 21.0% ] 20.51% | 78 | 100.0% |
[ 21.0% - 21.5% ] 21.47% | 843 | 16.7% |
[ 21.5% - 22.0% ] 21.74% | 69 | 60.6% |
[ 25.0% - 25.5% ] 25.26% | 95 | 63.2% |
[ 26.0% - 26.5% ] 26.16% | 692 | 19.7% |
[ 28.0% - 28.5% ] 28.09% | 89 | 100.0% |
[ 34.5% - 35.0% ] 34.78% | 46 | 100.0% |
[ 47.0% - 47.5% ] 47.06% | 51 | 36.4% |
[ 50.0% - 50.5% ] 50.00% | 60 | 72.7% |
[ 52.0% - 52.5% ] 52.38% | 9,755 | 72.4% |
[ 56.0% - 56.5% ] 56.38% | 752 | 54.3% |
[ 56.5% - 57.0% ] 56.68% | 4,453 | 72.7% |
[ 58.0% - 58.5% ] 58.36% | 4,150 | 73.8% |
[ 66.5% - 67.0% ] 66.61% | 3,255 | 57.2% |
[ 69.5% - 70.0% ] 69.59% | 3,088 | 57.2% |
[ 74.0% - 74.5% ] 74.11% | 1,128 | 71.0% |
[ 75.5% - 76.0% ] 75.68% | 1,242 | 39.3% |
[ 79.0% - 79.5% ] 79.28% | 444 | 9.0% |
[ 79.5% - 80.0% ] 79.68% | 630 | 14.5% |
[ 82.5% - 83.0% ] 82.67% | 554 | 5.8% |
[ 84.5% - 85.0% ] 84.88% | 344 | 14.0% |
[ 85.0% - 85.5% ] 85.30% | 558 | 21.3% |
[ 87.5% - 88.0% ] 87.79% | 1,114 | 10.8% |
[ 89.0% - 89.5% ] 89.30% | 1,308 | 27.5% |
[ 89.5% - 90.0% ] 89.95% | 378 | 8.9% |
[ 91.0% - 91.5% ] 91.10% | 1,686 | 35.2% |
[ 92.5% - 93.0% ] 92.91% | 846 | 25.3% |
[ 93.5% - 94.0% ] 93.57% | 809 | 25.2% |
[ 94.0% - 94.5% ] 94.31% | 1,652 | 12.5% |
[ 94.5% - 95.0% ] 94.72% | 1,136 | 8.7% |
[ 95.5% - 96.0% ] 95.96% | 1,288 | 21.1% |
[ 96.0% - 96.5% ] 96.08% | 1,072 | 14.7% |
[ 97.0% - 97.5% ] 97.19% | 2,138 | 4.2% |
[ 98.0% - 98.5% ] 98.30% | 824 | 27.1% |
[ 99.5% - 100.0% ] 100.00% | 488 | 8.7% |