Inupiat Self-Care Disability

COMPARE

Inupiat
Race
Ancestry
AfghanAfricanAlaska NativeAlaskan AthabascanAlbanianAleutAlsatianAmericanApacheArabArapahoArgentineanArmenianAssyrian/Chaldean/SyriacAustralianAustrianBahamianBangladeshiBarbadianBasqueBelgianBelizeanBermudanBhutaneseBlackfeetBolivianBrazilianBritishBritish West IndianBulgarianBurmeseCajunCambodianCanadianCape VerdeanCarpatho RusynCelticCentral AmericanCentral American IndianCherokeeCheyenneChickasawChileanChineseChippewaChoctawColombianColvilleComancheCosta RicanCreeCreekCroatianCrowCubanCypriotCzechCzechoslovakianDanishDelawareDominicanDutchDutch West IndianEastern EuropeanEcuadorianEgyptianEnglishEstonianEthiopianEuropeanFijianFilipinoFinnishFrenchFrench American IndianFrench CanadianGermanGerman RussianGhanaianGreekGuamanian/ChamorroGuatemalanGuyaneseHaitianHmongHonduranHopiHoumaHungarianIcelanderIndian (Asian)IndonesianInupiatIranianIraqiIrishIroquoisIsraeliItalianJamaicanJapaneseJordanianKenyanKiowaKoreanLaotianLatvianLebaneseLiberianLithuanianLumbeeLuxembourgerMacedonianMalaysianMalteseMarshalleseMenomineeMexicanMexican American IndianMongolianMoroccanNative HawaiianNavajoNepaleseNew ZealanderNicaraguanNigerianNorthern EuropeanNorwegianOkinawanOsageOttawaPaiutePakistaniPalestinianPanamanianParaguayanPennsylvania GermanPeruvianPimaPolishPortuguesePotawatomiPuebloPuerto RicanPuget Sound SalishRomanianRussianSalvadoranSamoanScandinavianScotch-IrishScottishSeminoleSenegaleseSerbianShoshoneSierra LeoneanSiouxSlavicSlovakSloveneSomaliSouth AfricanSouth AmericanSouth American IndianSoviet UnionSpaniardSpanishSpanish AmericanSpanish American IndianSri LankanSubsaharan AfricanSudaneseSwedishSwissSyrianTaiwaneseThaiTlingit-HaidaTohono O'OdhamTonganTrinidadian and TobagonianTsimshianTurkishU.S. Virgin IslanderUgandanUkrainianUruguayanUteVenezuelanVietnameseWelshWest IndianYakamaYaquiYugoslavianYumanYup'ikZimbabwean
Immigration
NonimmigrantsImmigrantsAfghanistanAfricaAlbaniaArgentinaArmeniaAsiaAustraliaAustriaBahamasBangladeshBarbadosBelarusBelgiumBelizeBoliviaBosnia and HerzegovinaBrazilBulgariaBurma/MyanmarCabo VerdeCambodiaCameroonCanadaCaribbeanCentral AmericaChileChinaColombiaCongoCosta RicaCroatiaCubaCzechoslovakiaDenmarkDominicaDominican RepublicEastern AfricaEastern AsiaEastern EuropeEcuadorEgyptEl SalvadorEnglandEritreaEthiopiaEuropeFijiFranceGermanyGhanaGreeceGrenadaGuatemalaGuyanaHaitiHondurasHong KongHungaryIndiaIndonesiaIranIraqIrelandIsraelItalyJamaicaJapanJordanKazakhstanKenyaKoreaKuwaitLaosLatin AmericaLatviaLebanonLiberiaLithuaniaMalaysiaMexicoMicronesiaMiddle AfricaMoldovaMoroccoNepalNetherlandsNicaraguaNigeriaNorth AmericaNorth MacedoniaNorthern AfricaNorthern EuropeNorwayOceaniaPakistanPanamaPeruPhilippinesPolandPortugalRomaniaRussiaSaudi ArabiaScotlandSenegalSerbiaSierra LeoneSingaporeSomaliaSouth AfricaSouth AmericaSouth Central AsiaSouth Eastern AsiaSouthern EuropeSpainSri LankaSt. Vincent and the GrenadinesSudanSwedenSwitzerlandSyriaTaiwanThailandTrinidad and TobagoTurkeyUgandaUkraineUruguayUzbekistanVenezuelaVietnamWest IndiesWestern AfricaWestern AsiaWestern EuropeYemenZaireZimbabweAzores
Select to Compare
Race
Ancestry
AfghanAfricanAlaska NativeAlaskan AthabascanAlbanianAleutAlsatianAmericanApacheArabArapahoArgentineanArmenianAssyrian/Chaldean/SyriacAustralianAustrianBahamianBangladeshiBarbadianBasqueBelgianBelizeanBermudanBhutaneseBlackfeetBolivianBrazilianBritishBritish West IndianBulgarianBurmeseCajunCambodianCanadianCape VerdeanCarpatho RusynCelticCentral AmericanCentral American IndianCherokeeCheyenneChickasawChileanChineseChippewaChoctawColombianColvilleComancheCosta RicanCreeCreekCroatianCrowCubanCypriotCzechCzechoslovakianDanishDelawareDominicanDutchDutch West IndianEastern EuropeanEcuadorianEgyptianEnglishEstonianEthiopianEuropeanFijianFilipinoFinnishFrenchFrench American IndianFrench CanadianGermanGerman RussianGhanaianGreekGuamanian/ChamorroGuatemalanGuyaneseHaitianHmongHonduranHopiHoumaHungarianIcelanderIndian (Asian)IndonesianIranianIraqiIrishIroquoisIsraeliItalianJamaicanJapaneseJordanianKenyanKiowaKoreanLaotianLatvianLebaneseLiberianLithuanianLumbeeLuxembourgerMacedonianMalaysianMalteseMarshalleseMenomineeMexicanMexican American IndianMongolianMoroccanNative HawaiianNavajoNepaleseNew ZealanderNicaraguanNigerianNorthern EuropeanNorwegianOkinawanOsageOttawaPaiutePakistaniPalestinianPanamanianParaguayanPennsylvania GermanPeruvianPimaPolishPortuguesePotawatomiPuebloPuerto RicanPuget Sound SalishRomanianRussianSalvadoranSamoanScandinavianScotch-IrishScottishSeminoleSenegaleseSerbianShoshoneSierra LeoneanSiouxSlavicSlovakSloveneSomaliSouth AfricanSouth AmericanSouth American IndianSoviet UnionSpaniardSpanishSpanish AmericanSpanish American IndianSri LankanSubsaharan AfricanSudaneseSwedishSwissSyrianTaiwaneseThaiTlingit-HaidaTohono O'OdhamTonganTrinidadian and TobagonianTsimshianTurkishU.S. Virgin IslanderUgandanUkrainianUruguayanUteVenezuelanVietnameseWelshWest IndianYakamaYaquiYugoslavianYumanYup'ikZimbabwean
Immigration
NonimmigrantsImmigrantsAfghanistanAfricaAlbaniaArgentinaArmeniaAsiaAustraliaAustriaBahamasBangladeshBarbadosBelarusBelgiumBelizeBoliviaBosnia and HerzegovinaBrazilBulgariaBurma/MyanmarCabo VerdeCambodiaCameroonCanadaCaribbeanCentral AmericaChileChinaColombiaCongoCosta RicaCroatiaCubaCzechoslovakiaDenmarkDominicaDominican RepublicEastern AfricaEastern AsiaEastern EuropeEcuadorEgyptEl SalvadorEnglandEritreaEthiopiaEuropeFijiFranceGermanyGhanaGreeceGrenadaGuatemalaGuyanaHaitiHondurasHong KongHungaryIndiaIndonesiaIranIraqIrelandIsraelItalyJamaicaJapanJordanKazakhstanKenyaKoreaKuwaitLaosLatin AmericaLatviaLebanonLiberiaLithuaniaMalaysiaMexicoMicronesiaMiddle AfricaMoldovaMoroccoNepalNetherlandsNicaraguaNigeriaNorth AmericaNorth MacedoniaNorthern AfricaNorthern EuropeNorwayOceaniaPakistanPanamaPeruPhilippinesPolandPortugalRomaniaRussiaSaudi ArabiaScotlandSenegalSerbiaSierra LeoneSingaporeSomaliaSouth AfricaSouth AmericaSouth Central AsiaSouth Eastern AsiaSouthern EuropeSpainSri LankaSt. Vincent and the GrenadinesSudanSwedenSwitzerlandSyriaTaiwanThailandTrinidad and TobagoTurkeyUgandaUkraineUruguayUzbekistanVenezuelaVietnamWest IndiesWestern AfricaWestern AsiaWestern EuropeYemenZaireZimbabweAzores
Self-Care Disability
Income
Poverty
Unemployment
Labor Participation
Family Structure
Vehicle Availability
Education Level
Disability

Inupiat Self-Care Disability
Exceptional

2.2%
SELF-CARE DISABILITY
99.9/ 100
METRIC RATING
28th/ 347
METRIC RANK

Inupiat Self-Care Disability Correlation Chart

The statistical analysis conducted on geographies consisting of 96,290,518 people shows a mild negative correlation between the proportion of Inupiat and percentage of population with self-care disability in the United States with a correlation coefficient (R) of -0.318 and weighted average of 2.2%. On average, for every 1% (one percent) increase in Inupiat within a typical geography, there is a decrease of 0.0097% in percentage of population with self-care disability.
Inupiat Self-Care Disability
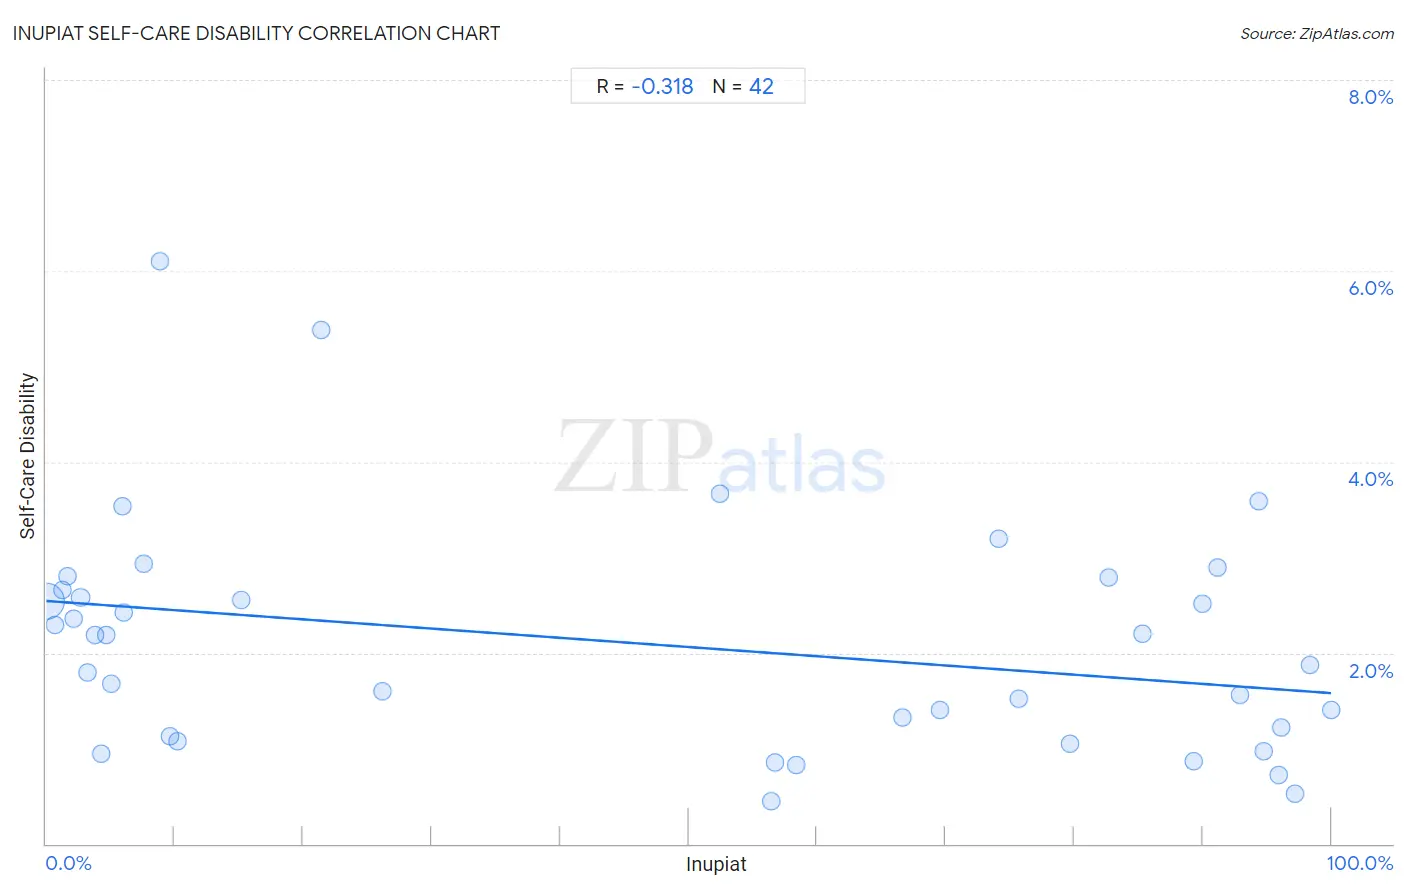
It is essential to understand that the correlation between the percentage of Inupiat and percentage of population with self-care disability does not imply a direct cause-and-effect relationship. It remains uncertain whether the presence of Inupiat influences an upward or downward trend in the level of percentage of population with self-care disability within an area, or if Inupiat simply ended up residing in those areas with higher or lower levels of percentage of population with self-care disability due to other factors.

Demographics Similar to Inupiat by Self-Care Disability

In terms of self-care disability, the demographic groups most similar to Inupiat are Immigrants from Zimbabwe (2.3%, a difference of 0.090%), Venezuelan (2.2%, a difference of 0.16%), Immigrants from Sri Lanka (2.2%, a difference of 0.17%), Turkish (2.2%, a difference of 0.24%), and Cypriot (2.2%, a difference of 0.35%).
DemographicsRating | RankSelf-Care Disability
Bulgarians
100.0
/100
|
#21
Exceptional
2.2%
Immigrants from Venezuela
100.0
/100
|
#22
Exceptional
2.2%
Cambodians
100.0
/100
|
#23
Exceptional
2.2%
Cypriots
100.0
/100
|
#24
Exceptional
2.2%
Turks
100.0
/100
|
#25
Exceptional
2.2%
Immigrants from Sri Lanka
99.9
/100
|
#26
Exceptional
2.2%
Venezuelans
99.9
/100
|
#27
Exceptional
2.2%
Inupiat
99.9
/100
|
#28
Exceptional
2.2%
Immigrants from Zimbabwe
99.9
/100
|
#29
Exceptional
2.3%
Paraguayans
99.9
/100
|
#30
Exceptional
2.3%
Danes
99.9
/100
|
#31
Exceptional
2.3%
Burmese
99.9
/100
|
#32
Exceptional
2.3%
Immigrants from Korea
99.9
/100
|
#33
Exceptional
2.3%
Immigrants from Turkey
99.9
/100
|
#34
Exceptional
2.3%
Immigrants from Australia
99.9
/100
|
#35
Exceptional
2.3%

Inupiat Self-Care Disability Correlation Summary

MeasurementInupiat DataSelf-Care Disability Data
Minimum0.028%0.45%
Maximum100.0%6.1%
Range100.0%5.7%
Mean46.1%2.1%
Median54.4%2.0%
Interquartile 25% (IQ1)5.1%1.1%
Interquartile 75% (IQ3)89.3%2.7%
Interquartile Range (IQR)84.2%1.5%
Standard Deviation (Sample)39.6%1.2%
Standard Deviation (Population)39.2%1.2%

Correlation Details

Inupiat PercentileSample SizeSelf-Care Disability
[
0.0%
-
0.5%
]
0.028%
94,651,7202.5%
[
0.5%
-
1.0%
]
0.70%
425,1732.3%
[
1.0%
-
1.5%
]
1.25%
320,0162.7%
[
1.5%
-
2.0%
]
1.64%
96,6392.8%
[
2.0%
-
2.5%
]
2.17%
456,2812.4%
[
2.5%
-
3.0%
]
2.67%
168,1212.6%
[
3.0%
-
3.5%
]
3.19%
32,7281.8%
[
3.5%
-
4.0%
]
3.75%
68,4042.2%
[
4.0%
-
4.5%
]
4.24%
9,9040.94%
[
4.5%
-
5.0%
]
4.63%
2,1592.2%
[
5.0%
-
5.5%
]
5.06%
7,3281.7%
[
5.5%
-
6.0%
]
5.93%
8433.5%
[
6.0%
-
6.5%
]
6.05%
1,6542.4%
[
7.5%
-
8.0%
]
7.61%
4602.9%
[
8.5%
-
9.0%
]
8.85%
4526.1%
[
9.5%
-
10.0%
]
9.60%
4,2291.1%
[
10.0%
-
10.5%
]
10.25%
4781.1%
[
15.0%
-
15.5%
]
15.20%
3292.5%
[
21.0%
-
21.5%
]
21.38%
1,1135.4%
[
26.0%
-
26.5%
]
26.16%
6921.6%
[
52.0%
-
52.5%
]
52.38%
9,7553.7%
[
56.0%
-
56.5%
]
56.38%
7520.45%
[
56.5%
-
57.0%
]
56.68%
4,4530.85%
[
58.0%
-
58.5%
]
58.36%
4,1500.83%
[
66.5%
-
67.0%
]
66.61%
3,2551.3%
[
69.5%
-
70.0%
]
69.59%
3,0881.4%
[
74.0%
-
74.5%
]
74.11%
1,1283.2%
[
75.5%
-
76.0%
]
75.68%
1,2421.5%
[
79.5%
-
80.0%
]
79.68%
6301.1%
[
82.5%
-
83.0%
]
82.67%
5542.8%
[
85.0%
-
85.5%
]
85.30%
5582.2%
[
89.0%
-
89.5%
]
89.30%
1,3080.86%
[
89.5%
-
90.0%
]
89.95%
3782.5%
[
91.0%
-
91.5%
]
91.10%
1,6862.9%
[
92.5%
-
93.0%
]
92.91%
8461.6%
[
94.0%
-
94.5%
]
94.31%
1,6523.6%
[
94.5%
-
95.0%
]
94.72%
1,1360.97%
[
95.5%
-
96.0%
]
95.96%
1,2880.72%
[
96.0%
-
96.5%
]
96.08%
1,0721.2%
[
97.0%
-
97.5%
]
97.19%
2,1380.52%
[
98.0%
-
98.5%
]
98.32%
2381.9%
[
99.5%
-
100.0%
]
100.00%
4881.4%