Inupiat 2 or more Vehicles in Household

COMPARE

Inupiat
Race
Ancestry
AfghanAfricanAlaska NativeAlaskan AthabascanAlbanianAleutAlsatianAmericanApacheArabArapahoArgentineanArmenianAssyrian/Chaldean/SyriacAustralianAustrianBahamianBangladeshiBarbadianBasqueBelgianBelizeanBermudanBhutaneseBlackfeetBolivianBrazilianBritishBritish West IndianBulgarianBurmeseCajunCambodianCanadianCape VerdeanCarpatho RusynCelticCentral AmericanCentral American IndianCherokeeCheyenneChickasawChileanChineseChippewaChoctawColombianColvilleComancheCosta RicanCreeCreekCroatianCrowCubanCypriotCzechCzechoslovakianDanishDelawareDominicanDutchDutch West IndianEastern EuropeanEcuadorianEgyptianEnglishEstonianEthiopianEuropeanFijianFilipinoFinnishFrenchFrench American IndianFrench CanadianGermanGerman RussianGhanaianGreekGuamanian/ChamorroGuatemalanGuyaneseHaitianHmongHonduranHopiHoumaHungarianIcelanderIndian (Asian)IndonesianInupiatIranianIraqiIrishIroquoisIsraeliItalianJamaicanJapaneseJordanianKenyanKiowaKoreanLaotianLatvianLebaneseLiberianLithuanianLumbeeLuxembourgerMacedonianMalaysianMalteseMarshalleseMenomineeMexicanMexican American IndianMongolianMoroccanNative HawaiianNavajoNepaleseNew ZealanderNicaraguanNigerianNorthern EuropeanNorwegianOkinawanOsageOttawaPaiutePakistaniPalestinianPanamanianParaguayanPennsylvania GermanPeruvianPimaPolishPortuguesePotawatomiPuebloPuerto RicanPuget Sound SalishRomanianRussianSalvadoranSamoanScandinavianScotch-IrishScottishSeminoleSenegaleseSerbianShoshoneSierra LeoneanSiouxSlavicSlovakSloveneSomaliSouth AfricanSouth AmericanSouth American IndianSoviet UnionSpaniardSpanishSpanish AmericanSpanish American IndianSri LankanSubsaharan AfricanSudaneseSwedishSwissSyrianTaiwaneseThaiTlingit-HaidaTohono O'OdhamTonganTrinidadian and TobagonianTsimshianTurkishU.S. Virgin IslanderUgandanUkrainianUruguayanUteVenezuelanVietnameseWelshWest IndianYakamaYaquiYugoslavianYumanYup'ikZimbabwean
Immigration
NonimmigrantsImmigrantsAfghanistanAfricaAlbaniaArgentinaArmeniaAsiaAustraliaAustriaBahamasBangladeshBarbadosBelarusBelgiumBelizeBoliviaBosnia and HerzegovinaBrazilBulgariaBurma/MyanmarCabo VerdeCambodiaCameroonCanadaCaribbeanCentral AmericaChileChinaColombiaCongoCosta RicaCroatiaCubaCzechoslovakiaDenmarkDominicaDominican RepublicEastern AfricaEastern AsiaEastern EuropeEcuadorEgyptEl SalvadorEnglandEritreaEthiopiaEuropeFijiFranceGermanyGhanaGreeceGrenadaGuatemalaGuyanaHaitiHondurasHong KongHungaryIndiaIndonesiaIranIraqIrelandIsraelItalyJamaicaJapanJordanKazakhstanKenyaKoreaKuwaitLaosLatin AmericaLatviaLebanonLiberiaLithuaniaMalaysiaMexicoMicronesiaMiddle AfricaMoldovaMoroccoNepalNetherlandsNicaraguaNigeriaNorth AmericaNorth MacedoniaNorthern AfricaNorthern EuropeNorwayOceaniaPakistanPanamaPeruPhilippinesPolandPortugalRomaniaRussiaSaudi ArabiaScotlandSenegalSerbiaSierra LeoneSingaporeSomaliaSouth AfricaSouth AmericaSouth Central AsiaSouth Eastern AsiaSouthern EuropeSpainSri LankaSt. Vincent and the GrenadinesSudanSwedenSwitzerlandSyriaTaiwanThailandTrinidad and TobagoTurkeyUgandaUkraineUruguayUzbekistanVenezuelaVietnamWest IndiesWestern AfricaWestern AsiaWestern EuropeYemenZaireZimbabweAzores
Select to Compare
Race
Ancestry
AfghanAfricanAlaska NativeAlaskan AthabascanAlbanianAleutAlsatianAmericanApacheArabArapahoArgentineanArmenianAssyrian/Chaldean/SyriacAustralianAustrianBahamianBangladeshiBarbadianBasqueBelgianBelizeanBermudanBhutaneseBlackfeetBolivianBrazilianBritishBritish West IndianBulgarianBurmeseCajunCambodianCanadianCape VerdeanCarpatho RusynCelticCentral AmericanCentral American IndianCherokeeCheyenneChickasawChileanChineseChippewaChoctawColombianColvilleComancheCosta RicanCreeCreekCroatianCrowCubanCypriotCzechCzechoslovakianDanishDelawareDominicanDutchDutch West IndianEastern EuropeanEcuadorianEgyptianEnglishEstonianEthiopianEuropeanFijianFilipinoFinnishFrenchFrench American IndianFrench CanadianGermanGerman RussianGhanaianGreekGuamanian/ChamorroGuatemalanGuyaneseHaitianHmongHonduranHopiHoumaHungarianIcelanderIndian (Asian)IndonesianIranianIraqiIrishIroquoisIsraeliItalianJamaicanJapaneseJordanianKenyanKiowaKoreanLaotianLatvianLebaneseLiberianLithuanianLumbeeLuxembourgerMacedonianMalaysianMalteseMarshalleseMenomineeMexicanMexican American IndianMongolianMoroccanNative HawaiianNavajoNepaleseNew ZealanderNicaraguanNigerianNorthern EuropeanNorwegianOkinawanOsageOttawaPaiutePakistaniPalestinianPanamanianParaguayanPennsylvania GermanPeruvianPimaPolishPortuguesePotawatomiPuebloPuerto RicanPuget Sound SalishRomanianRussianSalvadoranSamoanScandinavianScotch-IrishScottishSeminoleSenegaleseSerbianShoshoneSierra LeoneanSiouxSlavicSlovakSloveneSomaliSouth AfricanSouth AmericanSouth American IndianSoviet UnionSpaniardSpanishSpanish AmericanSpanish American IndianSri LankanSubsaharan AfricanSudaneseSwedishSwissSyrianTaiwaneseThaiTlingit-HaidaTohono O'OdhamTonganTrinidadian and TobagonianTsimshianTurkishU.S. Virgin IslanderUgandanUkrainianUruguayanUteVenezuelanVietnameseWelshWest IndianYakamaYaquiYugoslavianYumanYup'ikZimbabwean
Immigration
NonimmigrantsImmigrantsAfghanistanAfricaAlbaniaArgentinaArmeniaAsiaAustraliaAustriaBahamasBangladeshBarbadosBelarusBelgiumBelizeBoliviaBosnia and HerzegovinaBrazilBulgariaBurma/MyanmarCabo VerdeCambodiaCameroonCanadaCaribbeanCentral AmericaChileChinaColombiaCongoCosta RicaCroatiaCubaCzechoslovakiaDenmarkDominicaDominican RepublicEastern AfricaEastern AsiaEastern EuropeEcuadorEgyptEl SalvadorEnglandEritreaEthiopiaEuropeFijiFranceGermanyGhanaGreeceGrenadaGuatemalaGuyanaHaitiHondurasHong KongHungaryIndiaIndonesiaIranIraqIrelandIsraelItalyJamaicaJapanJordanKazakhstanKenyaKoreaKuwaitLaosLatin AmericaLatviaLebanonLiberiaLithuaniaMalaysiaMexicoMicronesiaMiddle AfricaMoldovaMoroccoNepalNetherlandsNicaraguaNigeriaNorth AmericaNorth MacedoniaNorthern AfricaNorthern EuropeNorwayOceaniaPakistanPanamaPeruPhilippinesPolandPortugalRomaniaRussiaSaudi ArabiaScotlandSenegalSerbiaSierra LeoneSingaporeSomaliaSouth AfricaSouth AmericaSouth Central AsiaSouth Eastern AsiaSouthern EuropeSpainSri LankaSt. Vincent and the GrenadinesSudanSwedenSwitzerlandSyriaTaiwanThailandTrinidad and TobagoTurkeyUgandaUkraineUruguayUzbekistanVenezuelaVietnamWest IndiesWestern AfricaWestern AsiaWestern EuropeYemenZaireZimbabweAzores
2 or more Vehicles in Household
Income
Poverty
Unemployment
Labor Participation
Family Structure
Vehicle Availability
Education Level
Disability

Inupiat 2 or more Vehicles in Household
Tragic

42.6%
2+ VEHICLES AVAILABLE
0.0/ 100
METRIC RATING
328th/ 347
METRIC RANK

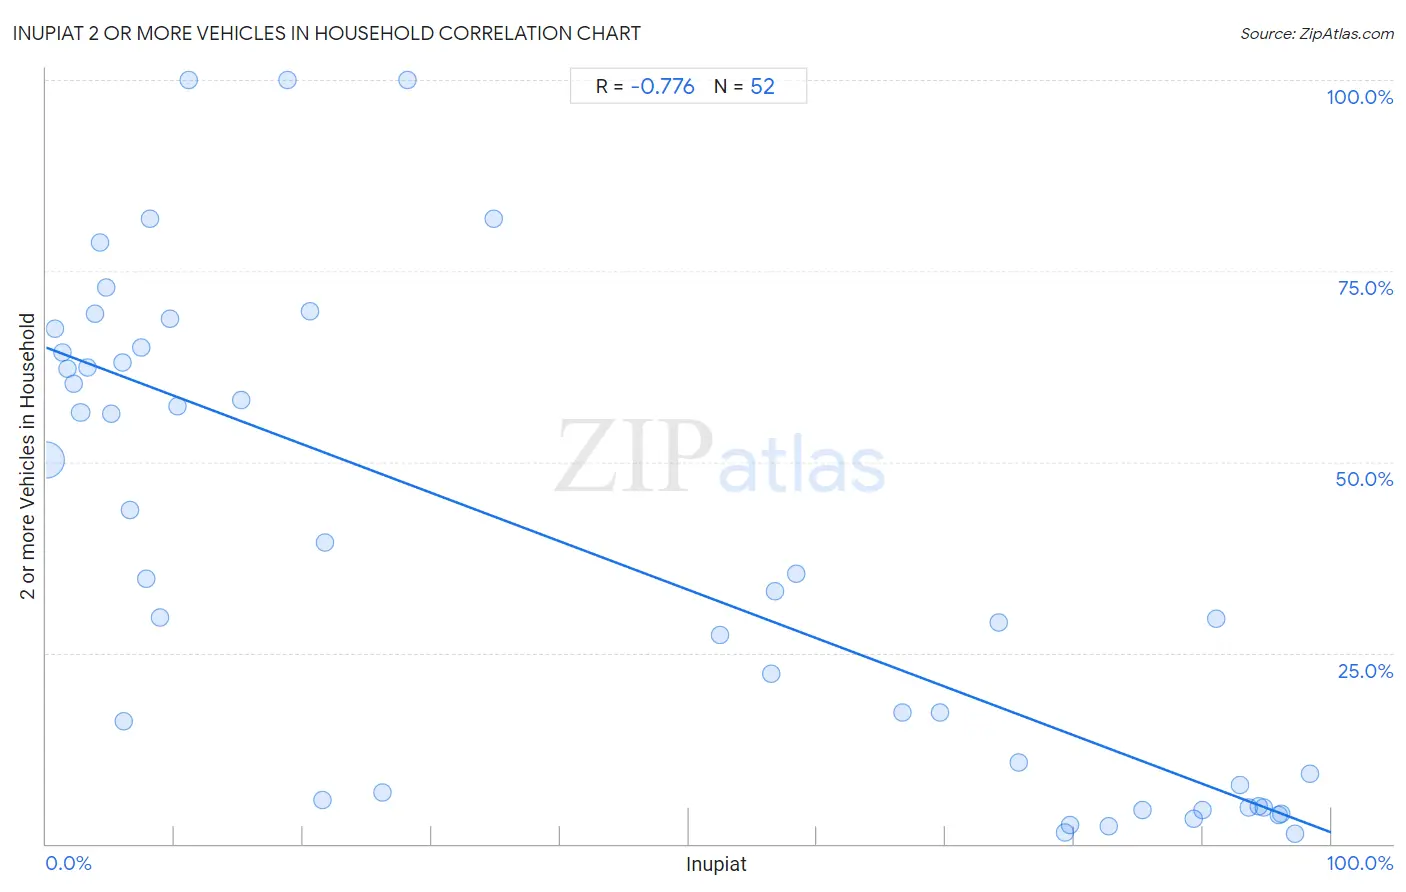
Inupiat 2 or more Vehicles in Household Correlation Chart

The statistical analysis conducted on geographies consisting of 96,302,889 people shows a strong negative correlation between the proportion of Inupiat and percentage of households with 2 or more vehicles available in the United States with a correlation coefficient (R) of -0.776 and weighted average of 42.6%. On average, for every 1% (one percent) increase in Inupiat within a typical geography, there is a decrease of 0.63% in percentage of households with 2 or more vehicles available.
Inupiat 2 or more Vehicles in Household
It is essential to understand that the correlation between the percentage of Inupiat and percentage of households with 2 or more vehicles available does not imply a direct cause-and-effect relationship. It remains uncertain whether the presence of Inupiat influences an upward or downward trend in the level of percentage of households with 2 or more vehicles available within an area, or if Inupiat simply ended up residing in those areas with higher or lower levels of percentage of households with 2 or more vehicles available due to other factors.

Demographics Similar to Inupiat by 2 or more Vehicles in Household

In terms of 2 or more vehicles in household, the demographic groups most similar to Inupiat are Immigrants from Yemen (42.8%, a difference of 0.50%), Immigrants from Senegal (43.0%, a difference of 0.91%), Immigrants from West Indies (43.1%, a difference of 1.1%), Ecuadorian (42.0%, a difference of 1.6%), and Immigrants from Cabo Verde (43.3%, a difference of 1.6%).
DemographicsRating | Rank2 or more Vehicles in Household
Immigrants from Jamaica
0.0
/100
|
#321
Tragic
44.5%
Senegalese
0.0
/100
|
#322
Tragic
44.2%
Immigrants from Caribbean
0.0
/100
|
#323
Tragic
44.2%
Immigrants from Cabo Verde
0.0
/100
|
#324
Tragic
43.3%
Immigrants from West Indies
0.0
/100
|
#325
Tragic
43.1%
Immigrants from Senegal
0.0
/100
|
#326
Tragic
43.0%
Immigrants from Yemen
0.0
/100
|
#327
Tragic
42.8%
Inupiat
0.0
/100
|
#328
Tragic
42.6%
Ecuadorians
0.0
/100
|
#329
Tragic
42.0%
Immigrants from Dominica
0.0
/100
|
#330
Tragic
41.6%
West Indians
0.0
/100
|
#331
Tragic
41.3%
Trinidadians and Tobagonians
0.0
/100
|
#332
Tragic
40.9%
Immigrants from Ecuador
0.0
/100
|
#333
Tragic
40.5%
Immigrants from Trinidad and Tobago
0.0
/100
|
#334
Tragic
40.3%
Immigrants from Bangladesh
0.0
/100
|
#335
Tragic
38.8%

Inupiat 2 or more Vehicles in Household Correlation Summary

MeasurementInupiat Data2 or more Vehicles in Household Data
Minimum0.028%1.4%
Maximum98.3%100.0%
Range98.3%98.6%
Mean41.7%38.5%
Median23.9%33.9%
Interquartile 25% (IQ1)6.3%6.2%
Interquartile 75% (IQ3)81.2%63.7%
Interquartile Range (IQR)74.9%57.5%
Standard Deviation (Sample)37.6%30.7%
Standard Deviation (Population)37.2%30.4%

Correlation Details

Inupiat PercentileSample Size2 or more Vehicles in Household
[
0.0%
-
0.5%
]
0.028%
94,661,19050.2%
[
0.5%
-
1.0%
]
0.70%
428,59167.4%
[
1.0%
-
1.5%
]
1.25%
320,42164.4%
[
1.5%
-
2.0%
]
1.64%
96,51862.2%
[
2.0%
-
2.5%
]
2.17%
452,87260.3%
[
2.5%
-
3.0%
]
2.67%
168,70256.5%
[
3.0%
-
3.5%
]
3.19%
32,64062.3%
[
3.5%
-
4.0%
]
3.75%
68,82469.3%
[
4.0%
-
4.5%
]
4.18%
7,50878.7%
[
4.5%
-
5.0%
]
4.69%
3,07072.8%
[
5.0%
-
5.5%
]
5.06%
6,46456.3%
[
5.5%
-
6.0%
]
5.93%
84363.0%
[
6.0%
-
6.5%
]
6.06%
1,96416.0%
[
6.5%
-
7.0%
]
6.50%
2,76843.8%
[
7.0%
-
7.5%
]
7.41%
5465.0%
[
7.5%
-
8.0%
]
7.77%
92734.8%
[
8.0%
-
8.5%
]
8.05%
58481.8%
[
8.5%
-
9.0%
]
8.82%
49929.6%
[
9.5%
-
10.0%
]
9.60%
4,22968.8%
[
10.0%
-
10.5%
]
10.25%
47857.2%
[
11.0%
-
11.5%
]
11.11%
9100.0%
[
15.0%
-
15.5%
]
15.20%
32958.0%
[
18.5%
-
19.0%
]
18.75%
16100.0%
[
20.5%
-
21.0%
]
20.51%
7869.8%
[
21.0%
-
21.5%
]
21.47%
8435.7%
[
21.5%
-
22.0%
]
21.74%
6939.4%
[
26.0%
-
26.5%
]
26.16%
6926.7%
[
28.0%
-
28.5%
]
28.09%
89100.0%
[
34.5%
-
35.0%
]
34.78%
4681.8%
[
52.0%
-
52.5%
]
52.38%
9,75527.4%
[
56.0%
-
56.5%
]
56.38%
75222.2%
[
56.5%
-
57.0%
]
56.68%
4,45333.1%
[
58.0%
-
58.5%
]
58.36%
4,15035.4%
[
66.5%
-
67.0%
]
66.61%
3,25517.1%
[
69.5%
-
70.0%
]
69.59%
3,08817.1%
[
74.0%
-
74.5%
]
74.11%
1,12829.0%
[
75.5%
-
76.0%
]
75.68%
1,24210.7%
[
79.0%
-
79.5%
]
79.28%
4441.5%
[
79.5%
-
80.0%
]
79.68%
6302.4%
[
82.5%
-
83.0%
]
82.67%
5542.3%
[
85.0%
-
85.5%
]
85.30%
5584.5%
[
89.0%
-
89.5%
]
89.30%
1,3083.3%
[
89.5%
-
90.0%
]
89.95%
3784.4%
[
91.0%
-
91.5%
]
91.06%
1,29829.5%
[
92.5%
-
93.0%
]
92.91%
8467.7%
[
93.5%
-
94.0%
]
93.57%
8094.8%
[
94.0%
-
94.5%
]
94.31%
1,6524.9%
[
94.5%
-
95.0%
]
94.72%
1,1364.7%
[
95.5%
-
96.0%
]
95.96%
1,2883.8%
[
96.0%
-
96.5%
]
96.08%
1,0723.9%
[
97.0%
-
97.5%
]
97.14%
1,5381.4%
[
98.0%
-
98.5%
]
98.32%
2389.1%