Inupiat Married-couple Households
COMPARE
Inupiat
Select to Compare
Married-couple Households
Inupiat Married-couple Households
42.4%
MARRIED-COUPLE HOUSEHOLDS
0.0/ 100
METRIC RATING
283rd/ 347
METRIC RANK
Inupiat Married-couple Households Correlation Chart
The statistical analysis conducted on geographies consisting of 96,320,700 people shows a mild negative correlation between the proportion of Inupiat and percentage of married-couple family households in the United States with a correlation coefficient (R) of -0.395 and weighted average of 42.4%. On average, for every 1% (one percent) increase in Inupiat within a typical geography, there is a decrease of 0.15% in percentage of married-couple family households.
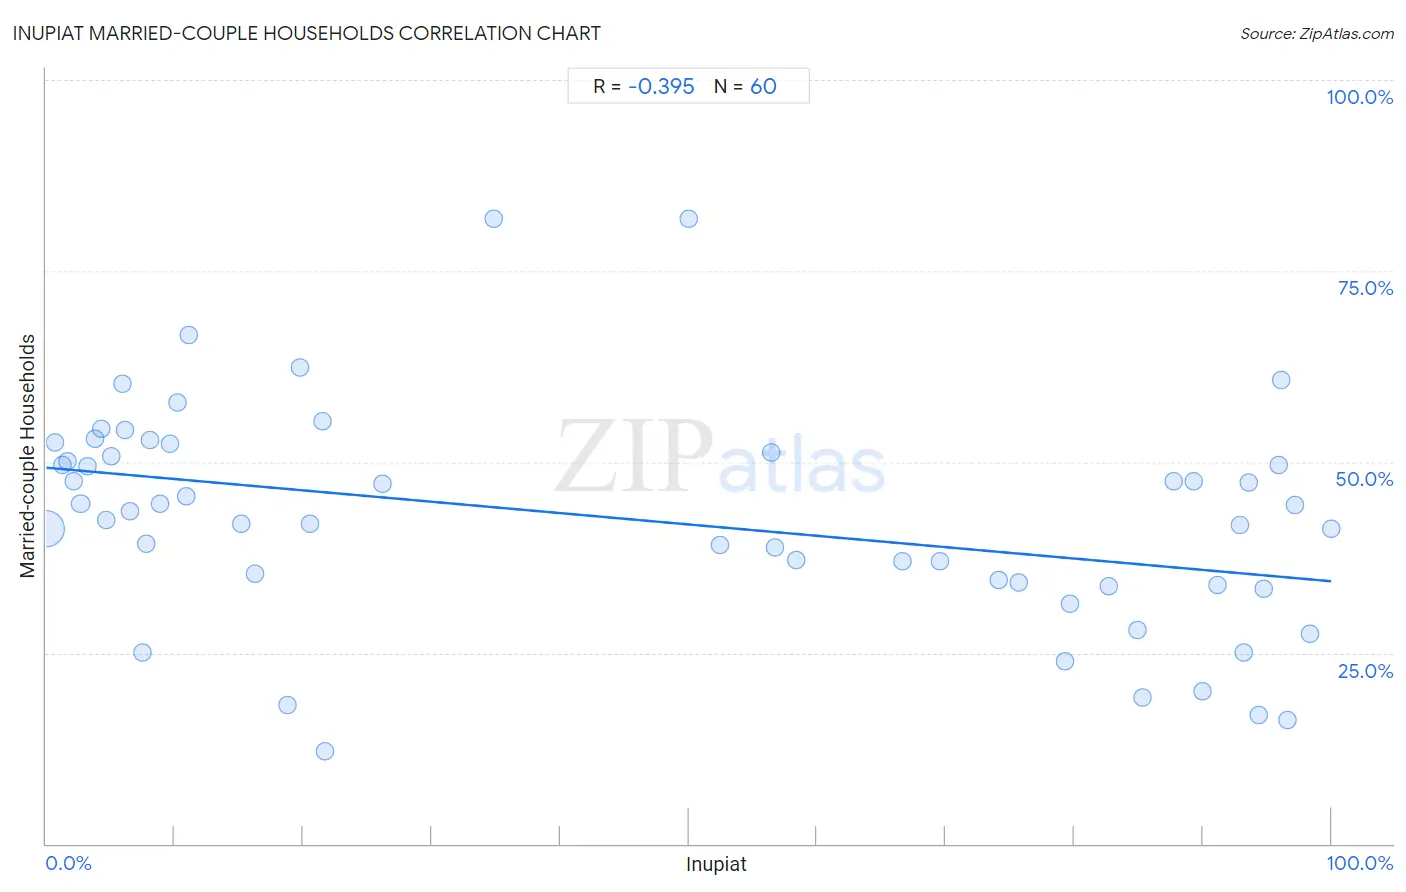
It is essential to understand that the correlation between the percentage of Inupiat and percentage of married-couple family households does not imply a direct cause-and-effect relationship. It remains uncertain whether the presence of Inupiat influences an upward or downward trend in the level of percentage of married-couple family households within an area, or if Inupiat simply ended up residing in those areas with higher or lower levels of percentage of married-couple family households due to other factors.
Demographics Similar to Inupiat by Married-couple Households
In terms of married-couple households, the demographic groups most similar to Inupiat are Bermudan (42.4%, a difference of 0.10%), Cheyenne (42.3%, a difference of 0.36%), Ghanaian (42.2%, a difference of 0.39%), Belizean (42.2%, a difference of 0.39%), and Chippewa (42.1%, a difference of 0.63%).
| Demographics | Rating | Rank | Married-couple Households |
| Immigrants from Ethiopia | 0.0 /100 | #276 | Tragic 43.1% |
| Immigrants from Eastern Africa | 0.0 /100 | #277 | Tragic 42.9% |
| Immigrants from Africa | 0.0 /100 | #278 | Tragic 42.9% |
| Sierra Leoneans | 0.0 /100 | #279 | Tragic 42.9% |
| Immigrants from Ecuador | 0.0 /100 | #280 | Tragic 42.9% |
| Immigrants from Guatemala | 0.0 /100 | #281 | Tragic 42.8% |
| Bermudans | 0.0 /100 | #282 | Tragic 42.4% |
| Inupiat | 0.0 /100 | #283 | Tragic 42.4% |
| Cheyenne | 0.0 /100 | #284 | Tragic 42.3% |
| Ghanaians | 0.0 /100 | #285 | Tragic 42.2% |
| Belizeans | 0.0 /100 | #286 | Tragic 42.2% |
| Chippewa | 0.0 /100 | #287 | Tragic 42.1% |
| Immigrants from Eritrea | 0.0 /100 | #288 | Tragic 42.1% |
| Sudanese | 0.0 /100 | #289 | Tragic 42.1% |
| Hondurans | 0.0 /100 | #290 | Tragic 42.1% |
Inupiat Married-couple Households Correlation Summary
| Measurement | Inupiat Data | Married-couple Households Data |
| Minimum | 0.028% | 12.1% |
| Maximum | 100.0% | 81.8% |
| Range | 100.0% | 69.7% |
| Mean | 45.0% | 42.6% |
| Median | 30.5% | 43.0% |
| Interquartile 25% (IQ1) | 7.6% | 34.1% |
| Interquartile 75% (IQ3) | 86.5% | 51.0% |
| Interquartile Range (IQR) | 78.9% | 16.9% |
| Standard Deviation (Sample) | 38.3% | 14.4% |
| Standard Deviation (Population) | 37.9% | 14.3% |
Correlation Details
| Inupiat Percentile | Sample Size | Married-couple Households |
[ 0.0% - 0.5% ] 0.028% | 94,661,986 | 41.2% |
[ 0.5% - 1.0% ] 0.70% | 429,603 | 52.6% |
[ 1.0% - 1.5% ] 1.25% | 320,421 | 49.6% |
[ 1.5% - 2.0% ] 1.64% | 98,518 | 50.0% |
[ 2.0% - 2.5% ] 2.17% | 453,266 | 47.4% |
[ 2.5% - 3.0% ] 2.67% | 170,010 | 44.4% |
[ 3.0% - 3.5% ] 3.19% | 32,728 | 49.5% |
[ 3.5% - 4.0% ] 3.75% | 70,281 | 53.0% |
[ 4.0% - 4.5% ] 4.24% | 10,052 | 54.4% |
[ 4.5% - 5.0% ] 4.69% | 3,070 | 42.4% |
[ 5.0% - 5.5% ] 5.06% | 7,328 | 50.8% |
[ 5.5% - 6.0% ] 5.90% | 983 | 60.3% |
[ 6.0% - 6.5% ] 6.11% | 2,372 | 54.2% |
[ 6.5% - 7.0% ] 6.50% | 2,768 | 43.6% |
[ 7.0% - 7.5% ] 7.46% | 134 | 25.1% |
[ 7.5% - 8.0% ] 7.77% | 927 | 39.2% |
[ 8.0% - 8.5% ] 8.05% | 584 | 52.9% |
[ 8.5% - 9.0% ] 8.82% | 499 | 44.5% |
[ 9.5% - 10.0% ] 9.60% | 4,229 | 52.4% |
[ 10.0% - 10.5% ] 10.25% | 478 | 57.8% |
[ 10.5% - 11.0% ] 10.92% | 119 | 45.5% |
[ 11.0% - 11.5% ] 11.11% | 9 | 66.7% |
[ 15.0% - 15.5% ] 15.20% | 329 | 42.0% |
[ 16.0% - 16.5% ] 16.23% | 616 | 35.4% |
[ 18.5% - 19.0% ] 18.75% | 16 | 18.2% |
[ 19.5% - 20.0% ] 19.76% | 1,640 | 62.3% |
[ 20.5% - 21.0% ] 20.51% | 78 | 41.9% |
[ 21.0% - 21.5% ] 21.47% | 843 | 55.2% |
[ 21.5% - 22.0% ] 21.74% | 69 | 12.1% |
[ 26.0% - 26.5% ] 26.16% | 692 | 47.2% |
[ 34.5% - 35.0% ] 34.78% | 46 | 81.8% |
[ 50.0% - 50.5% ] 50.00% | 60 | 81.8% |
[ 52.0% - 52.5% ] 52.38% | 9,755 | 39.1% |
[ 56.0% - 56.5% ] 56.38% | 752 | 51.2% |
[ 56.5% - 57.0% ] 56.68% | 4,453 | 38.7% |
[ 58.0% - 58.5% ] 58.36% | 4,150 | 37.1% |
[ 66.5% - 67.0% ] 66.61% | 3,255 | 37.0% |
[ 69.5% - 70.0% ] 69.59% | 3,088 | 37.0% |
[ 74.0% - 74.5% ] 74.11% | 1,128 | 34.6% |
[ 75.5% - 76.0% ] 75.68% | 1,242 | 34.3% |
[ 79.0% - 79.5% ] 79.28% | 444 | 23.9% |
[ 79.5% - 80.0% ] 79.68% | 630 | 31.5% |
[ 82.5% - 83.0% ] 82.67% | 554 | 33.7% |
[ 84.5% - 85.0% ] 84.88% | 344 | 27.9% |
[ 85.0% - 85.5% ] 85.30% | 558 | 19.1% |
[ 87.5% - 88.0% ] 87.79% | 1,114 | 47.5% |
[ 89.0% - 89.5% ] 89.30% | 1,308 | 47.5% |
[ 89.5% - 90.0% ] 89.95% | 378 | 20.0% |
[ 91.0% - 91.5% ] 91.10% | 1,686 | 34.0% |
[ 92.5% - 93.0% ] 92.91% | 846 | 41.8% |
[ 93.0% - 93.5% ] 93.23% | 266 | 25.0% |
[ 93.5% - 94.0% ] 93.57% | 809 | 47.3% |
[ 94.0% - 94.5% ] 94.31% | 1,652 | 16.8% |
[ 94.5% - 95.0% ] 94.72% | 1,136 | 33.3% |
[ 95.5% - 96.0% ] 95.96% | 1,288 | 49.6% |
[ 96.0% - 96.5% ] 96.08% | 1,072 | 60.8% |
[ 96.5% - 97.0% ] 96.60% | 588 | 16.3% |
[ 97.0% - 97.5% ] 97.19% | 2,138 | 44.4% |
[ 98.0% - 98.5% ] 98.30% | 824 | 27.6% |
[ 99.5% - 100.0% ] 100.00% | 488 | 41.3% |