Inupiat Median Female Earnings

COMPARE

Inupiat
Race
Ancestry
AfghanAfricanAlaska NativeAlaskan AthabascanAlbanianAleutAlsatianAmericanApacheArabArapahoArgentineanArmenianAssyrian/Chaldean/SyriacAustralianAustrianBahamianBangladeshiBarbadianBasqueBelgianBelizeanBermudanBhutaneseBlackfeetBolivianBrazilianBritishBritish West IndianBulgarianBurmeseCajunCambodianCanadianCape VerdeanCarpatho RusynCelticCentral AmericanCentral American IndianCherokeeCheyenneChickasawChileanChineseChippewaChoctawColombianColvilleComancheCosta RicanCreeCreekCroatianCrowCubanCypriotCzechCzechoslovakianDanishDelawareDominicanDutchDutch West IndianEastern EuropeanEcuadorianEgyptianEnglishEstonianEthiopianEuropeanFijianFilipinoFinnishFrenchFrench American IndianFrench CanadianGermanGerman RussianGhanaianGreekGuamanian/ChamorroGuatemalanGuyaneseHaitianHmongHonduranHopiHoumaHungarianIcelanderIndian (Asian)IndonesianInupiatIranianIraqiIrishIroquoisIsraeliItalianJamaicanJapaneseJordanianKenyanKiowaKoreanLaotianLatvianLebaneseLiberianLithuanianLumbeeLuxembourgerMacedonianMalaysianMalteseMarshalleseMenomineeMexicanMexican American IndianMongolianMoroccanNative HawaiianNavajoNepaleseNew ZealanderNicaraguanNigerianNorthern EuropeanNorwegianOkinawanOsageOttawaPaiutePakistaniPalestinianPanamanianParaguayanPennsylvania GermanPeruvianPimaPolishPortuguesePotawatomiPuebloPuerto RicanPuget Sound SalishRomanianRussianSalvadoranSamoanScandinavianScotch-IrishScottishSeminoleSenegaleseSerbianShoshoneSierra LeoneanSiouxSlavicSlovakSloveneSomaliSouth AfricanSouth AmericanSouth American IndianSoviet UnionSpaniardSpanishSpanish AmericanSpanish American IndianSri LankanSubsaharan AfricanSudaneseSwedishSwissSyrianTaiwaneseThaiTlingit-HaidaTohono O'OdhamTonganTrinidadian and TobagonianTsimshianTurkishU.S. Virgin IslanderUgandanUkrainianUruguayanUteVenezuelanVietnameseWelshWest IndianYakamaYaquiYugoslavianYumanYup'ikZimbabwean
Immigration
NonimmigrantsImmigrantsAfghanistanAfricaAlbaniaArgentinaArmeniaAsiaAustraliaAustriaBahamasBangladeshBarbadosBelarusBelgiumBelizeBoliviaBosnia and HerzegovinaBrazilBulgariaBurma/MyanmarCabo VerdeCambodiaCameroonCanadaCaribbeanCentral AmericaChileChinaColombiaCongoCosta RicaCroatiaCubaCzechoslovakiaDenmarkDominicaDominican RepublicEastern AfricaEastern AsiaEastern EuropeEcuadorEgyptEl SalvadorEnglandEritreaEthiopiaEuropeFijiFranceGermanyGhanaGreeceGrenadaGuatemalaGuyanaHaitiHondurasHong KongHungaryIndiaIndonesiaIranIraqIrelandIsraelItalyJamaicaJapanJordanKazakhstanKenyaKoreaKuwaitLaosLatin AmericaLatviaLebanonLiberiaLithuaniaMalaysiaMexicoMicronesiaMiddle AfricaMoldovaMoroccoNepalNetherlandsNicaraguaNigeriaNorth AmericaNorth MacedoniaNorthern AfricaNorthern EuropeNorwayOceaniaPakistanPanamaPeruPhilippinesPolandPortugalRomaniaRussiaSaudi ArabiaScotlandSenegalSerbiaSierra LeoneSingaporeSomaliaSouth AfricaSouth AmericaSouth Central AsiaSouth Eastern AsiaSouthern EuropeSpainSri LankaSt. Vincent and the GrenadinesSudanSwedenSwitzerlandSyriaTaiwanThailandTrinidad and TobagoTurkeyUgandaUkraineUruguayUzbekistanVenezuelaVietnamWest IndiesWestern AfricaWestern AsiaWestern EuropeYemenZaireZimbabweAzores
Select to Compare
Race
Ancestry
AfghanAfricanAlaska NativeAlaskan AthabascanAlbanianAleutAlsatianAmericanApacheArabArapahoArgentineanArmenianAssyrian/Chaldean/SyriacAustralianAustrianBahamianBangladeshiBarbadianBasqueBelgianBelizeanBermudanBhutaneseBlackfeetBolivianBrazilianBritishBritish West IndianBulgarianBurmeseCajunCambodianCanadianCape VerdeanCarpatho RusynCelticCentral AmericanCentral American IndianCherokeeCheyenneChickasawChileanChineseChippewaChoctawColombianColvilleComancheCosta RicanCreeCreekCroatianCrowCubanCypriotCzechCzechoslovakianDanishDelawareDominicanDutchDutch West IndianEastern EuropeanEcuadorianEgyptianEnglishEstonianEthiopianEuropeanFijianFilipinoFinnishFrenchFrench American IndianFrench CanadianGermanGerman RussianGhanaianGreekGuamanian/ChamorroGuatemalanGuyaneseHaitianHmongHonduranHopiHoumaHungarianIcelanderIndian (Asian)IndonesianIranianIraqiIrishIroquoisIsraeliItalianJamaicanJapaneseJordanianKenyanKiowaKoreanLaotianLatvianLebaneseLiberianLithuanianLumbeeLuxembourgerMacedonianMalaysianMalteseMarshalleseMenomineeMexicanMexican American IndianMongolianMoroccanNative HawaiianNavajoNepaleseNew ZealanderNicaraguanNigerianNorthern EuropeanNorwegianOkinawanOsageOttawaPaiutePakistaniPalestinianPanamanianParaguayanPennsylvania GermanPeruvianPimaPolishPortuguesePotawatomiPuebloPuerto RicanPuget Sound SalishRomanianRussianSalvadoranSamoanScandinavianScotch-IrishScottishSeminoleSenegaleseSerbianShoshoneSierra LeoneanSiouxSlavicSlovakSloveneSomaliSouth AfricanSouth AmericanSouth American IndianSoviet UnionSpaniardSpanishSpanish AmericanSpanish American IndianSri LankanSubsaharan AfricanSudaneseSwedishSwissSyrianTaiwaneseThaiTlingit-HaidaTohono O'OdhamTonganTrinidadian and TobagonianTsimshianTurkishU.S. Virgin IslanderUgandanUkrainianUruguayanUteVenezuelanVietnameseWelshWest IndianYakamaYaquiYugoslavianYumanYup'ikZimbabwean
Immigration
NonimmigrantsImmigrantsAfghanistanAfricaAlbaniaArgentinaArmeniaAsiaAustraliaAustriaBahamasBangladeshBarbadosBelarusBelgiumBelizeBoliviaBosnia and HerzegovinaBrazilBulgariaBurma/MyanmarCabo VerdeCambodiaCameroonCanadaCaribbeanCentral AmericaChileChinaColombiaCongoCosta RicaCroatiaCubaCzechoslovakiaDenmarkDominicaDominican RepublicEastern AfricaEastern AsiaEastern EuropeEcuadorEgyptEl SalvadorEnglandEritreaEthiopiaEuropeFijiFranceGermanyGhanaGreeceGrenadaGuatemalaGuyanaHaitiHondurasHong KongHungaryIndiaIndonesiaIranIraqIrelandIsraelItalyJamaicaJapanJordanKazakhstanKenyaKoreaKuwaitLaosLatin AmericaLatviaLebanonLiberiaLithuaniaMalaysiaMexicoMicronesiaMiddle AfricaMoldovaMoroccoNepalNetherlandsNicaraguaNigeriaNorth AmericaNorth MacedoniaNorthern AfricaNorthern EuropeNorwayOceaniaPakistanPanamaPeruPhilippinesPolandPortugalRomaniaRussiaSaudi ArabiaScotlandSenegalSerbiaSierra LeoneSingaporeSomaliaSouth AfricaSouth AmericaSouth Central AsiaSouth Eastern AsiaSouthern EuropeSpainSri LankaSt. Vincent and the GrenadinesSudanSwedenSwitzerlandSyriaTaiwanThailandTrinidad and TobagoTurkeyUgandaUkraineUruguayUzbekistanVenezuelaVietnamWest IndiesWestern AfricaWestern AsiaWestern EuropeYemenZaireZimbabweAzores
Median Female Earnings
Income
Poverty
Unemployment
Labor Participation
Family Structure
Vehicle Availability
Education Level
Disability

Inupiat Median Female Earnings
Good

$40,080
EARNINGS | FEMALES
68.9/ 100
METRIC RATING
160th/ 347
METRIC RANK

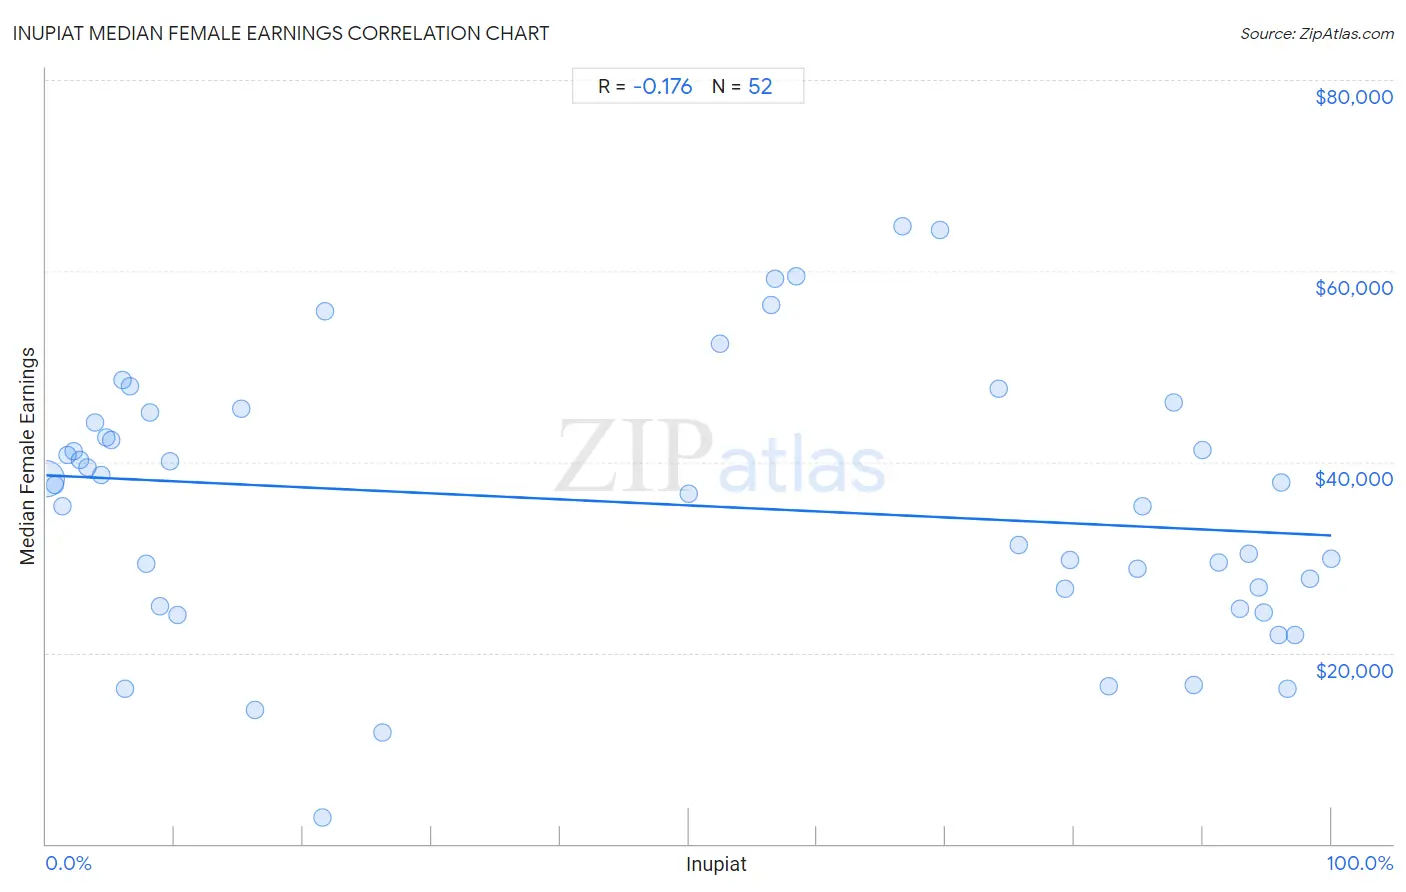
Inupiat Median Female Earnings Correlation Chart

The statistical analysis conducted on geographies consisting of 96,311,190 people shows a poor negative correlation between the proportion of Inupiat and median female earnings in the United States with a correlation coefficient (R) of -0.176 and weighted average of $40,080. On average, for every 1% (one percent) increase in Inupiat within a typical geography, there is a decrease of $63 in median female earnings.
Inupiat Median Female Earnings
It is essential to understand that the correlation between the percentage of Inupiat and median female earnings does not imply a direct cause-and-effect relationship. It remains uncertain whether the presence of Inupiat influences an upward or downward trend in the level of median female earnings within an area, or if Inupiat simply ended up residing in those areas with higher or lower levels of median female earnings due to other factors.

Demographics Similar to Inupiat by Median Female Earnings

In terms of median female earnings, the demographic groups most similar to Inupiat are Alsatian ($40,060, a difference of 0.050%), South American Indian ($40,019, a difference of 0.15%), Immigrants from Vietnam ($40,153, a difference of 0.18%), Lebanese ($40,006, a difference of 0.18%), and Immigrants from Senegal ($40,157, a difference of 0.19%).
DemographicsRating | RankMedian Female Earnings
British West Indians
77.7
/100
|
#153
Good
$40,299
Immigrants from Oceania
77.6
/100
|
#154
Good
$40,297
Immigrants from Africa
76.2
/100
|
#155
Good
$40,257
Peruvians
75.3
/100
|
#156
Good
$40,234
Portuguese
73.0
/100
|
#157
Good
$40,177
Immigrants from Senegal
72.2
/100
|
#158
Good
$40,157
Immigrants from Vietnam
72.0
/100
|
#159
Good
$40,153
Inupiat
68.9
/100
|
#160
Good
$40,080
Alsatians
68.0
/100
|
#161
Good
$40,060
South American Indians
66.1
/100
|
#162
Good
$40,019
Lebanese
65.5
/100
|
#163
Good
$40,006
Immigrants from Saudi Arabia
62.9
/100
|
#164
Good
$39,952
Immigrants from Bangladesh
60.8
/100
|
#165
Good
$39,910
Immigrants from Ghana
60.0
/100
|
#166
Good
$39,894
Luxembourgers
59.9
/100
|
#167
Average
$39,891

Inupiat Median Female Earnings Correlation Summary

MeasurementInupiat DataMedian Female Earnings Data
Minimum0.028%$2,800
Maximum100.0%$64,688
Range100.0%$61,888
Mean47.7%$35,589
Median54.4%$37,155
Interquartile 25% (IQ1)6.3%$25,800
Interquartile 75% (IQ3)88.5%$44,695
Interquartile Range (IQR)82.2%$18,895
Standard Deviation (Sample)39.1%$13,962
Standard Deviation (Population)38.7%$13,827

Correlation Details

Inupiat PercentileSample SizeMedian Female Earnings
[
0.0%
-
0.5%
]
0.028%
94,669,372$38,274
[
0.5%
-
1.0%
]
0.70%
429,026$37,643
[
1.0%
-
1.5%
]
1.25%
315,737$35,362
[
1.5%
-
2.0%
]
1.64%
95,522$40,738
[
2.0%
-
2.5%
]
2.17%
455,645$41,161
[
2.5%
-
3.0%
]
2.67%
167,944$40,210
[
3.0%
-
3.5%
]
3.19%
31,157$39,463
[
3.5%
-
4.0%
]
3.75%
67,850$44,182
[
4.0%
-
4.5%
]
4.24%
10,052$38,586
[
4.5%
-
5.0%
]
4.69%
3,070$42,617
[
5.0%
-
5.5%
]
5.06%
6,464$42,262
[
5.5%
-
6.0%
]
5.90%
983$48,560
[
6.0%
-
6.5%
]
6.10%
1,934$16,243
[
6.5%
-
7.0%
]
6.50%
2,768$47,875
[
7.5%
-
8.0%
]
7.77%
888$29,275
[
8.0%
-
8.5%
]
8.05%
584$45,208
[
8.5%
-
9.0%
]
8.82%
499$24,932
[
9.5%
-
10.0%
]
9.60%
4,179$40,104
[
10.0%
-
10.5%
]
10.25%
478$24,000
[
15.0%
-
15.5%
]
15.20%
329$45,500
[
16.0%
-
16.5%
]
16.23%
616$14,063
[
21.0%
-
21.5%
]
21.47%
843$2,800
[
21.5%
-
22.0%
]
21.74%
69$55,833
[
26.0%
-
26.5%
]
26.16%
692$11,705
[
50.0%
-
50.5%
]
50.00%
60$36,667
[
52.0%
-
52.5%
]
52.38%
9,755$52,350
[
56.0%
-
56.5%
]
56.38%
752$56,458
[
56.5%
-
57.0%
]
56.68%
4,453$59,226
[
58.0%
-
58.5%
]
58.36%
4,150$59,469
[
66.5%
-
67.0%
]
66.61%
3,255$64,688
[
69.5%
-
70.0%
]
69.59%
3,088$64,231
[
74.0%
-
74.5%
]
74.11%
1,128$47,639
[
75.5%
-
76.0%
]
75.68%
1,242$31,250
[
79.0%
-
79.5%
]
79.28%
444$26,667
[
79.5%
-
80.0%
]
79.68%
630$29,688
[
82.5%
-
83.0%
]
82.67%
554$16,507
[
84.5%
-
85.0%
]
84.88%
344$28,750
[
85.0%
-
85.5%
]
85.30%
558$35,313
[
87.5%
-
88.0%
]
87.79%
1,114$46,250
[
89.0%
-
89.5%
]
89.30%
1,308$16,612
[
89.5%
-
90.0%
]
89.95%
378$41,250
[
91.0%
-
91.5%
]
91.24%
388$29,500
[
92.5%
-
93.0%
]
92.91%
846$24,583
[
93.5%
-
94.0%
]
93.57%
809$30,406
[
94.0%
-
94.5%
]
94.31%
1,652$26,856
[
94.5%
-
95.0%
]
94.72%
1,136$24,219
[
95.5%
-
96.0%
]
95.96%
1,288$21,875
[
96.0%
-
96.5%
]
96.08%
1,072$37,813
[
96.5%
-
97.0%
]
96.60%
588$16,250
[
97.0%
-
97.5%
]
97.19%
2,138$21,881
[
98.0%
-
98.5%
]
98.30%
824$27,806
[
99.5%
-
100.0%
]
100.00%
535$29,826