Guamanian/Chamorro 1 or more Vehicles in Household
COMPARE
Guamanian/Chamorro
Select to Compare
1 or more Vehicles in Household
Guamanian/Chamorro 1 or more Vehicles in Household
92.1%
1+ VEHICLES AVAILABLE
99.9/ 100
METRIC RATING
50th/ 347
METRIC RANK
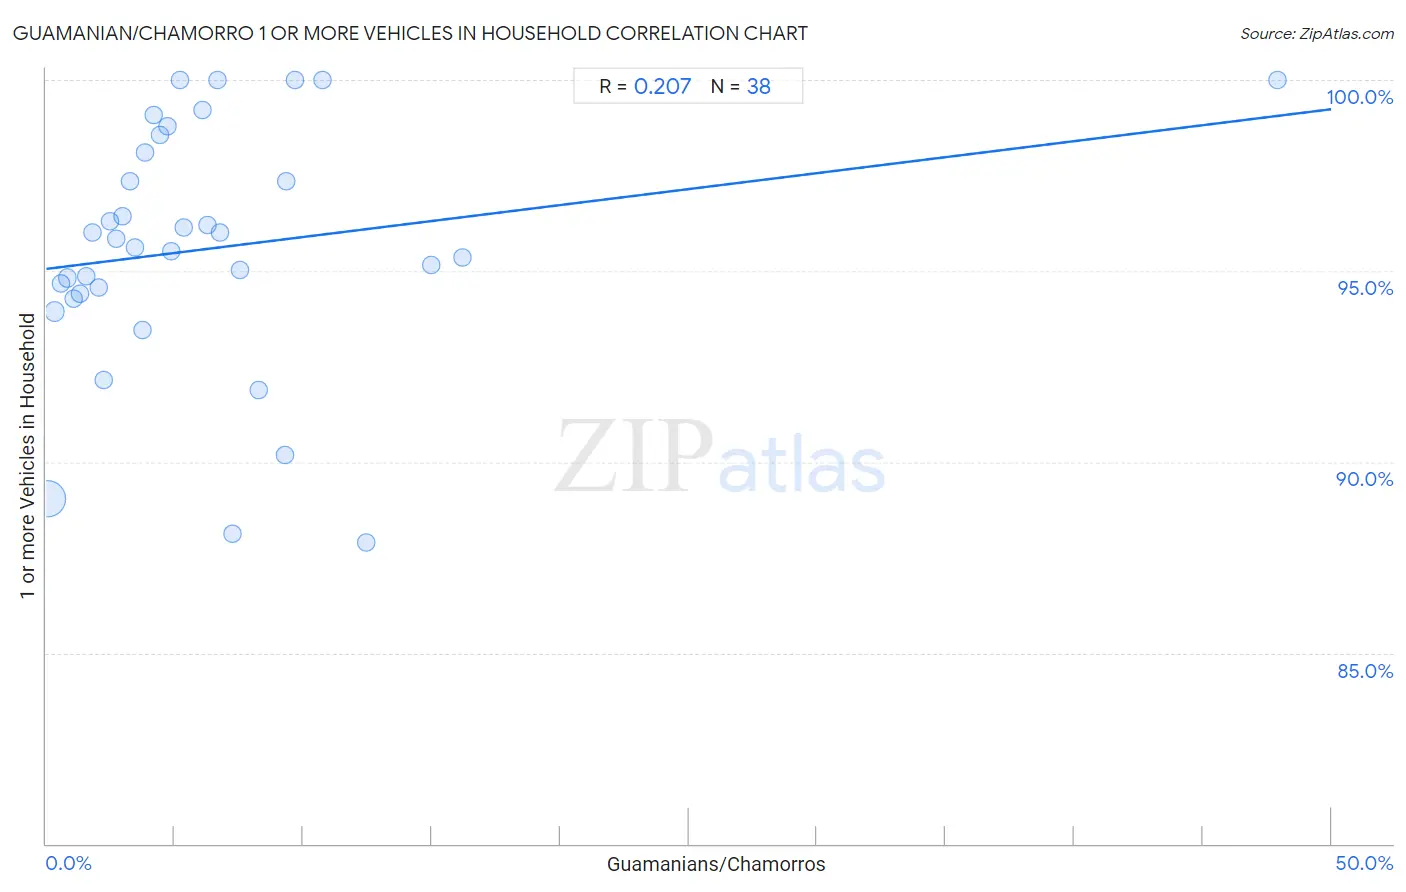
Guamanian/Chamorro 1 or more Vehicles in Household Correlation Chart
The statistical analysis conducted on geographies consisting of 221,882,598 people shows a weak positive correlation between the proportion of Guamanians/Chamorros and percentage of households with 1 or more vehicles available in the United States with a correlation coefficient (R) of 0.207 and weighted average of 92.1%. On average, for every 1% (one percent) increase in Guamanians/Chamorros within a typical geography, there is an increase of 0.084% in percentage of households with 1 or more vehicles available.
It is essential to understand that the correlation between the percentage of Guamanians/Chamorros and percentage of households with 1 or more vehicles available does not imply a direct cause-and-effect relationship. It remains uncertain whether the presence of Guamanians/Chamorros influences an upward or downward trend in the level of percentage of households with 1 or more vehicles available within an area, or if Guamanians/Chamorros simply ended up residing in those areas with higher or lower levels of percentage of households with 1 or more vehicles available due to other factors.
Demographics Similar to Guamanians/Chamorros by 1 or more Vehicles in Household
In terms of 1 or more vehicles in household, the demographic groups most similar to Guamanians/Chamorros are Afghan (92.1%, a difference of 0.010%), Celtic (92.1%, a difference of 0.010%), Belgian (92.1%, a difference of 0.020%), Korean (92.1%, a difference of 0.040%), and Hawaiian (92.0%, a difference of 0.070%).
| Demographics | Rating | Rank | 1 or more Vehicles in Household |
| Spanish | 99.9 /100 | #43 | Exceptional 92.3% |
| Choctaw | 99.9 /100 | #44 | Exceptional 92.2% |
| Nonimmigrants | 99.9 /100 | #45 | Exceptional 92.2% |
| Immigrants from Fiji | 99.9 /100 | #46 | Exceptional 92.2% |
| Northern Europeans | 99.9 /100 | #47 | Exceptional 92.2% |
| Belgians | 99.9 /100 | #48 | Exceptional 92.1% |
| Afghans | 99.9 /100 | #49 | Exceptional 92.1% |
| Guamanians/Chamorros | 99.9 /100 | #50 | Exceptional 92.1% |
| Celtics | 99.9 /100 | #51 | Exceptional 92.1% |
| Koreans | 99.9 /100 | #52 | Exceptional 92.1% |
| Hawaiians | 99.9 /100 | #53 | Exceptional 92.0% |
| Slovenes | 99.9 /100 | #54 | Exceptional 92.0% |
| Immigrants from Afghanistan | 99.9 /100 | #55 | Exceptional 92.0% |
| Immigrants from Venezuela | 99.9 /100 | #56 | Exceptional 92.0% |
| Iraqis | 99.8 /100 | #57 | Exceptional 91.9% |
Guamanian/Chamorro 1 or more Vehicles in Household Correlation Summary
| Measurement | Guamanian/Chamorro Data | 1 or more Vehicles in Household Data |
| Minimum | 0.066% | 87.9% |
| Maximum | 47.9% | 100.0% |
| Range | 47.8% | 12.1% |
| Mean | 6.4% | 95.6% |
| Median | 4.6% | 95.7% |
| Interquartile 25% (IQ1) | 2.2% | 94.4% |
| Interquartile 75% (IQ3) | 7.5% | 98.1% |
| Interquartile Range (IQR) | 5.3% | 3.7% |
| Standard Deviation (Sample) | 8.0% | 3.2% |
| Standard Deviation (Population) | 7.9% | 3.2% |
Correlation Details
| Guamanian/Chamorro Percentile | Sample Size | 1 or more Vehicles in Household |
[ 0.0% - 0.5% ] 0.066% | 190,836,626 | 89.0% |
[ 0.0% - 0.5% ] 0.33% | 20,066,566 | 93.9% |
[ 0.5% - 1.0% ] 0.58% | 5,624,046 | 94.7% |
[ 0.5% - 1.0% ] 0.82% | 2,549,885 | 94.8% |
[ 1.0% - 1.5% ] 1.08% | 1,256,534 | 94.3% |
[ 1.0% - 1.5% ] 1.29% | 477,617 | 94.4% |
[ 1.5% - 2.0% ] 1.54% | 409,375 | 94.9% |
[ 1.5% - 2.0% ] 1.78% | 203,350 | 96.0% |
[ 2.0% - 2.5% ] 2.04% | 135,549 | 94.6% |
[ 2.0% - 2.5% ] 2.22% | 66,564 | 92.1% |
[ 2.0% - 2.5% ] 2.49% | 49,703 | 96.3% |
[ 2.5% - 3.0% ] 2.74% | 24,712 | 95.9% |
[ 2.5% - 3.0% ] 2.99% | 30,241 | 96.4% |
[ 3.0% - 3.5% ] 3.26% | 27,988 | 97.4% |
[ 3.0% - 3.5% ] 3.45% | 45,984 | 95.6% |
[ 3.5% - 4.0% ] 3.75% | 9,680 | 93.5% |
[ 3.5% - 4.0% ] 3.86% | 4,608 | 98.1% |
[ 4.0% - 4.5% ] 4.19% | 7,782 | 99.1% |
[ 4.0% - 4.5% ] 4.41% | 5,379 | 98.6% |
[ 4.5% - 5.0% ] 4.72% | 25,535 | 98.8% |
[ 4.5% - 5.0% ] 4.88% | 3,748 | 95.5% |
[ 5.0% - 5.5% ] 5.22% | 1,974 | 100.0% |
[ 5.0% - 5.5% ] 5.36% | 261 | 96.1% |
[ 6.0% - 6.5% ] 6.07% | 4,758 | 99.2% |
[ 6.0% - 6.5% ] 6.27% | 1,642 | 96.2% |
[ 6.5% - 7.0% ] 6.65% | 857 | 100.0% |
[ 6.5% - 7.0% ] 6.77% | 1,388 | 96.0% |
[ 7.0% - 7.5% ] 7.27% | 1,211 | 88.1% |
[ 7.5% - 8.0% ] 7.55% | 1,669 | 95.0% |
[ 8.0% - 8.5% ] 8.29% | 5,262 | 91.9% |
[ 9.0% - 9.5% ] 9.30% | 172 | 90.2% |
[ 9.0% - 9.5% ] 9.34% | 578 | 97.3% |
[ 9.5% - 10.0% ] 9.70% | 402 | 100.0% |
[ 10.5% - 11.0% ] 10.74% | 121 | 100.0% |
[ 12.0% - 12.5% ] 12.46% | 313 | 87.9% |
[ 14.5% - 15.0% ] 14.97% | 294 | 95.2% |
[ 16.0% - 16.5% ] 16.19% | 105 | 95.3% |
[ 47.5% - 48.0% ] 47.90% | 119 | 100.0% |