Guamanian/Chamorro Unemployment Among Women with Children Ages 6 to 17 years

COMPARE

Guamanian/Chamorro
Race
Ancestry
AfghanAfricanAlaska NativeAlaskan AthabascanAlbanianAleutAlsatianAmericanApacheArabArapahoArgentineanArmenianAssyrian/Chaldean/SyriacAustralianAustrianBahamianBangladeshiBarbadianBasqueBelgianBelizeanBermudanBhutaneseBlackfeetBolivianBrazilianBritishBritish West IndianBulgarianBurmeseCajunCambodianCanadianCape VerdeanCarpatho RusynCelticCentral AmericanCentral American IndianCherokeeCheyenneChickasawChileanChineseChippewaChoctawColombianColvilleComancheCosta RicanCreeCreekCroatianCrowCubanCypriotCzechCzechoslovakianDanishDelawareDominicanDutchDutch West IndianEastern EuropeanEcuadorianEgyptianEnglishEstonianEthiopianEuropeanFijianFilipinoFinnishFrenchFrench American IndianFrench CanadianGermanGerman RussianGhanaianGreekGuamanian/ChamorroGuatemalanGuyaneseHaitianHmongHonduranHopiHoumaHungarianIcelanderIndian (Asian)IndonesianInupiatIranianIraqiIrishIroquoisIsraeliItalianJamaicanJapaneseJordanianKenyanKiowaKoreanLaotianLatvianLebaneseLiberianLithuanianLumbeeLuxembourgerMacedonianMalaysianMalteseMarshalleseMenomineeMexicanMexican American IndianMongolianMoroccanNative HawaiianNavajoNepaleseNew ZealanderNicaraguanNigerianNorthern EuropeanNorwegianOkinawanOsageOttawaPaiutePakistaniPalestinianPanamanianParaguayanPennsylvania GermanPeruvianPimaPolishPortuguesePotawatomiPuebloPuerto RicanPuget Sound SalishRomanianRussianSalvadoranSamoanScandinavianScotch-IrishScottishSeminoleSenegaleseSerbianShoshoneSierra LeoneanSiouxSlavicSlovakSloveneSomaliSouth AfricanSouth AmericanSouth American IndianSoviet UnionSpaniardSpanishSpanish AmericanSpanish American IndianSri LankanSubsaharan AfricanSudaneseSwedishSwissSyrianTaiwaneseThaiTlingit-HaidaTohono O'OdhamTonganTrinidadian and TobagonianTsimshianTurkishU.S. Virgin IslanderUgandanUkrainianUruguayanUteVenezuelanVietnameseWelshWest IndianYakamaYaquiYugoslavianYumanYup'ikZimbabwean
Immigration
NonimmigrantsImmigrantsAfghanistanAfricaAlbaniaArgentinaArmeniaAsiaAustraliaAustriaBahamasBangladeshBarbadosBelarusBelgiumBelizeBoliviaBosnia and HerzegovinaBrazilBulgariaBurma/MyanmarCabo VerdeCambodiaCameroonCanadaCaribbeanCentral AmericaChileChinaColombiaCongoCosta RicaCroatiaCubaCzechoslovakiaDenmarkDominicaDominican RepublicEastern AfricaEastern AsiaEastern EuropeEcuadorEgyptEl SalvadorEnglandEritreaEthiopiaEuropeFijiFranceGermanyGhanaGreeceGrenadaGuatemalaGuyanaHaitiHondurasHong KongHungaryIndiaIndonesiaIranIraqIrelandIsraelItalyJamaicaJapanJordanKazakhstanKenyaKoreaKuwaitLaosLatin AmericaLatviaLebanonLiberiaLithuaniaMalaysiaMexicoMicronesiaMiddle AfricaMoldovaMoroccoNepalNetherlandsNicaraguaNigeriaNorth AmericaNorth MacedoniaNorthern AfricaNorthern EuropeNorwayOceaniaPakistanPanamaPeruPhilippinesPolandPortugalRomaniaRussiaSaudi ArabiaScotlandSenegalSerbiaSierra LeoneSingaporeSomaliaSouth AfricaSouth AmericaSouth Central AsiaSouth Eastern AsiaSouthern EuropeSpainSri LankaSt. Vincent and the GrenadinesSudanSwedenSwitzerlandSyriaTaiwanThailandTrinidad and TobagoTurkeyUgandaUkraineUruguayUzbekistanVenezuelaVietnamWest IndiesWestern AfricaWestern AsiaWestern EuropeYemenZaireZimbabweAzores
Select to Compare
Race
Ancestry
AfghanAfricanAlaska NativeAlaskan AthabascanAlbanianAleutAlsatianAmericanApacheArabArapahoArgentineanArmenianAssyrian/Chaldean/SyriacAustralianAustrianBahamianBangladeshiBarbadianBasqueBelgianBelizeanBermudanBhutaneseBlackfeetBolivianBrazilianBritishBritish West IndianBulgarianBurmeseCajunCambodianCanadianCape VerdeanCarpatho RusynCelticCentral AmericanCentral American IndianCherokeeCheyenneChickasawChileanChineseChippewaChoctawColombianColvilleComancheCosta RicanCreeCreekCroatianCrowCubanCypriotCzechCzechoslovakianDanishDelawareDominicanDutchDutch West IndianEastern EuropeanEcuadorianEgyptianEnglishEstonianEthiopianEuropeanFijianFilipinoFinnishFrenchFrench American IndianFrench CanadianGermanGerman RussianGhanaianGreekGuatemalanGuyaneseHaitianHmongHonduranHopiHoumaHungarianIcelanderIndian (Asian)IndonesianInupiatIranianIraqiIrishIroquoisIsraeliItalianJamaicanJapaneseJordanianKenyanKiowaKoreanLaotianLatvianLebaneseLiberianLithuanianLumbeeLuxembourgerMacedonianMalaysianMalteseMarshalleseMenomineeMexicanMexican American IndianMongolianMoroccanNative HawaiianNavajoNepaleseNew ZealanderNicaraguanNigerianNorthern EuropeanNorwegianOkinawanOsageOttawaPaiutePakistaniPalestinianPanamanianParaguayanPennsylvania GermanPeruvianPimaPolishPortuguesePotawatomiPuebloPuerto RicanPuget Sound SalishRomanianRussianSalvadoranSamoanScandinavianScotch-IrishScottishSeminoleSenegaleseSerbianShoshoneSierra LeoneanSiouxSlavicSlovakSloveneSomaliSouth AfricanSouth AmericanSouth American IndianSoviet UnionSpaniardSpanishSpanish AmericanSpanish American IndianSri LankanSubsaharan AfricanSudaneseSwedishSwissSyrianTaiwaneseThaiTlingit-HaidaTohono O'OdhamTonganTrinidadian and TobagonianTsimshianTurkishU.S. Virgin IslanderUgandanUkrainianUruguayanUteVenezuelanVietnameseWelshWest IndianYakamaYaquiYugoslavianYumanYup'ikZimbabwean
Immigration
NonimmigrantsImmigrantsAfghanistanAfricaAlbaniaArgentinaArmeniaAsiaAustraliaAustriaBahamasBangladeshBarbadosBelarusBelgiumBelizeBoliviaBosnia and HerzegovinaBrazilBulgariaBurma/MyanmarCabo VerdeCambodiaCameroonCanadaCaribbeanCentral AmericaChileChinaColombiaCongoCosta RicaCroatiaCubaCzechoslovakiaDenmarkDominicaDominican RepublicEastern AfricaEastern AsiaEastern EuropeEcuadorEgyptEl SalvadorEnglandEritreaEthiopiaEuropeFijiFranceGermanyGhanaGreeceGrenadaGuatemalaGuyanaHaitiHondurasHong KongHungaryIndiaIndonesiaIranIraqIrelandIsraelItalyJamaicaJapanJordanKazakhstanKenyaKoreaKuwaitLaosLatin AmericaLatviaLebanonLiberiaLithuaniaMalaysiaMexicoMicronesiaMiddle AfricaMoldovaMoroccoNepalNetherlandsNicaraguaNigeriaNorth AmericaNorth MacedoniaNorthern AfricaNorthern EuropeNorwayOceaniaPakistanPanamaPeruPhilippinesPolandPortugalRomaniaRussiaSaudi ArabiaScotlandSenegalSerbiaSierra LeoneSingaporeSomaliaSouth AfricaSouth AmericaSouth Central AsiaSouth Eastern AsiaSouthern EuropeSpainSri LankaSt. Vincent and the GrenadinesSudanSwedenSwitzerlandSyriaTaiwanThailandTrinidad and TobagoTurkeyUgandaUkraineUruguayUzbekistanVenezuelaVietnamWest IndiesWestern AfricaWestern AsiaWestern EuropeYemenZaireZimbabweAzores
Unemployment Among Women with Children Ages 6 to 17 years
Income
Poverty
Unemployment
Labor Participation
Family Structure
Vehicle Availability
Education Level
Disability

Guamanian/Chamorro Unemployment Among Women with Children Ages 6 to 17 years
Fair

9.1%
UNEMPLOYMENT | WOMEN W/ CHILDREN 6 TO 17
27.2/ 100
METRIC RATING
192nd/ 347
METRIC RANK

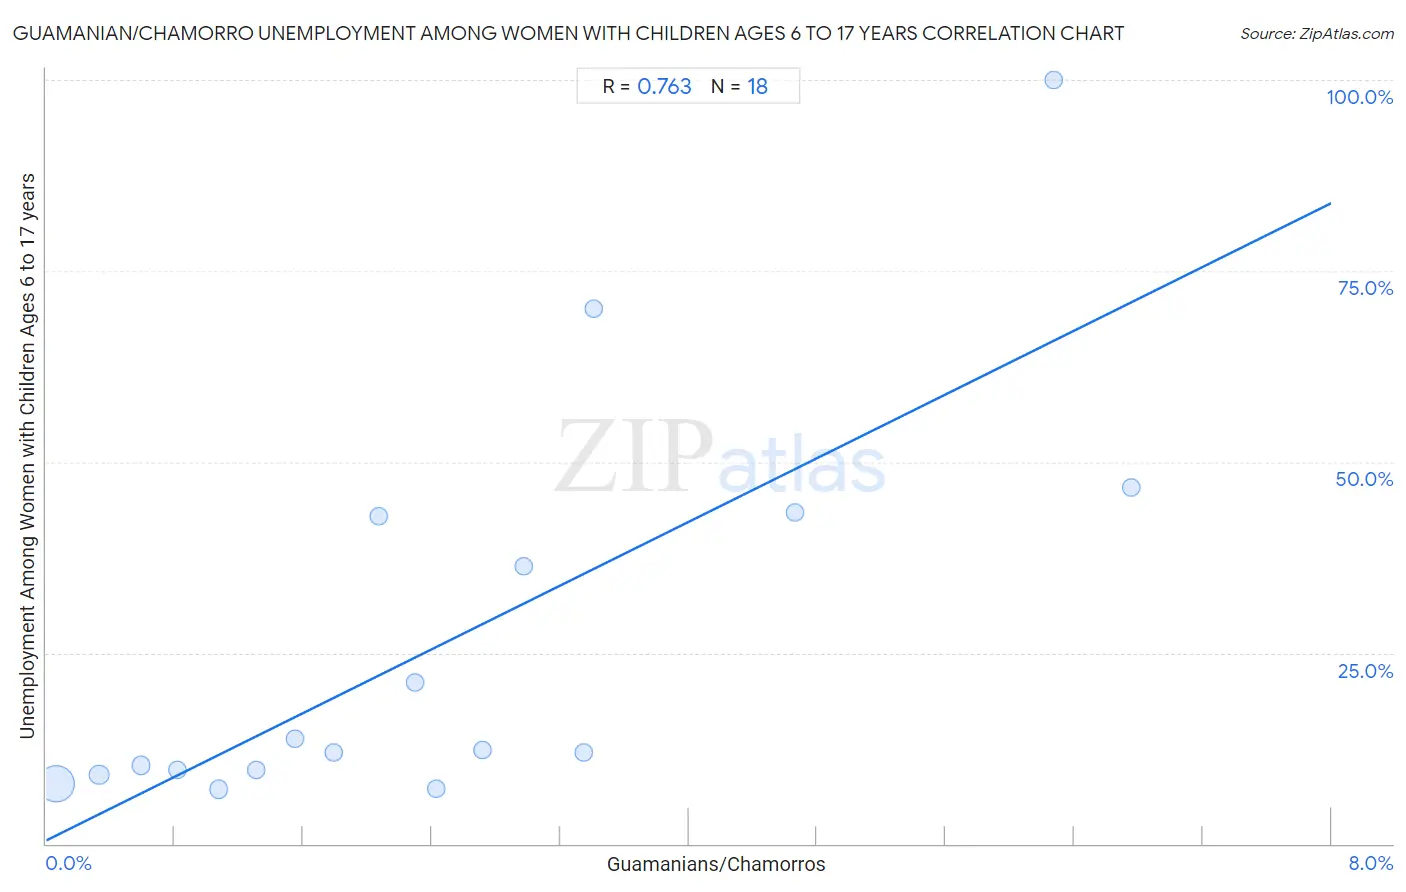
Guamanian/Chamorro Unemployment Among Women with Children Ages 6 to 17 years Correlation Chart

The statistical analysis conducted on geographies consisting of 180,746,926 people shows a strong positive correlation between the proportion of Guamanians/Chamorros and unemployment rate among women with children between the ages 6 and 17 in the United States with a correlation coefficient (R) of 0.763 and weighted average of 9.1%. On average, for every 1% (one percent) increase in Guamanians/Chamorros within a typical geography, there is an increase of 10.4% in unemployment rate among women with children between the ages 6 and 17.
Guamanian/Chamorro Unemployment Among Women with Children Ages 6 to 17 years
It is essential to understand that the correlation between the percentage of Guamanians/Chamorros and unemployment rate among women with children between the ages 6 and 17 does not imply a direct cause-and-effect relationship. It remains uncertain whether the presence of Guamanians/Chamorros influences an upward or downward trend in the level of unemployment rate among women with children between the ages 6 and 17 within an area, or if Guamanians/Chamorros simply ended up residing in those areas with higher or lower levels of unemployment rate among women with children between the ages 6 and 17 due to other factors.

Demographics Similar to Guamanians/Chamorros by Unemployment Among Women with Children Ages 6 to 17 years

In terms of unemployment among women with children ages 6 to 17 years, the demographic groups most similar to Guamanians/Chamorros are Slovene (9.1%, a difference of 0.070%), Belizean (9.1%, a difference of 0.070%), Immigrants from Turkey (9.1%, a difference of 0.070%), Immigrants (9.1%, a difference of 0.11%), and Immigrants from Kazakhstan (9.1%, a difference of 0.11%).
DemographicsRating | RankUnemployment Among Women with Children Ages 6 to 17 years
Immigrants from Congo
32.5
/100
|
#185
Fair
9.0%
Immigrants from Spain
32.4
/100
|
#186
Fair
9.0%
Comanche
30.0
/100
|
#187
Fair
9.0%
Immigrants from Syria
29.7
/100
|
#188
Fair
9.1%
Immigrants
29.2
/100
|
#189
Fair
9.1%
Slovenes
28.5
/100
|
#190
Fair
9.1%
Belizeans
28.4
/100
|
#191
Fair
9.1%
Guamanians/Chamorros
27.2
/100
|
#192
Fair
9.1%
Immigrants from Turkey
25.8
/100
|
#193
Fair
9.1%
Immigrants from Kazakhstan
25.3
/100
|
#194
Fair
9.1%
Austrians
25.0
/100
|
#195
Fair
9.1%
Brazilians
24.4
/100
|
#196
Fair
9.1%
Immigrants from Panama
24.3
/100
|
#197
Fair
9.1%
Guyanese
21.8
/100
|
#198
Fair
9.1%
Czechoslovakians
20.8
/100
|
#199
Fair
9.1%

Guamanian/Chamorro Unemployment Among Women with Children Ages 6 to 17 years Correlation Summary

MeasurementGuamanian/Chamorro DataUnemployment Among Women with Children Ages 6 to 17 years Data
Minimum0.063%7.1%
Maximum6.8%100.0%
Range6.7%92.9%
Mean2.5%26.2%
Median2.2%12.1%
Interquartile 25% (IQ1)1.1%9.6%
Interquartile 75% (IQ3)3.3%42.9%
Interquartile Range (IQR)2.3%33.3%
Standard Deviation (Sample)1.9%25.9%
Standard Deviation (Population)1.8%25.2%

Correlation Details

Guamanian/Chamorro PercentileSample SizeUnemployment Among Women with Children Ages 6 to 17 years
[
0.0%
-
0.5%
]
0.063%
159,545,8777.9%
[
0.0%
-
0.5%
]
0.33%
14,656,7829.0%
[
0.5%
-
1.0%
]
0.59%
3,445,39810.3%
[
0.5%
-
1.0%
]
0.82%
1,574,3629.6%
[
1.0%
-
1.5%
]
1.07%
776,6917.1%
[
1.0%
-
1.5%
]
1.30%
251,0929.7%
[
1.5%
-
2.0%
]
1.55%
266,01513.8%
[
1.5%
-
2.0%
]
1.79%
120,08812.0%
[
2.0%
-
2.5%
]
2.07%
43,10742.9%
[
2.0%
-
2.5%
]
2.30%
12,31521.2%
[
2.0%
-
2.5%
]
2.43%
12,2967.3%
[
2.5%
-
3.0%
]
2.72%
10,88712.2%
[
2.5%
-
3.0%
]
2.97%
6,38836.4%
[
3.0%
-
3.5%
]
3.34%
12,02611.9%
[
3.0%
-
3.5%
]
3.41%
5,42970.0%
[
4.5%
-
5.0%
]
4.66%
5,70343.4%
[
6.0%
-
6.5%
]
6.27%
1,611100.0%
[
6.5%
-
7.0%
]
6.75%
85946.7%