Guamanian/Chamorro Average Family Size
COMPARE
Guamanian/Chamorro
Select to Compare
Average Family Size
Guamanian/Chamorro Average Family Size
3.29
AVERAGE FAMILY SIZE
98.6/ 100
METRIC RATING
100th/ 347
METRIC RANK
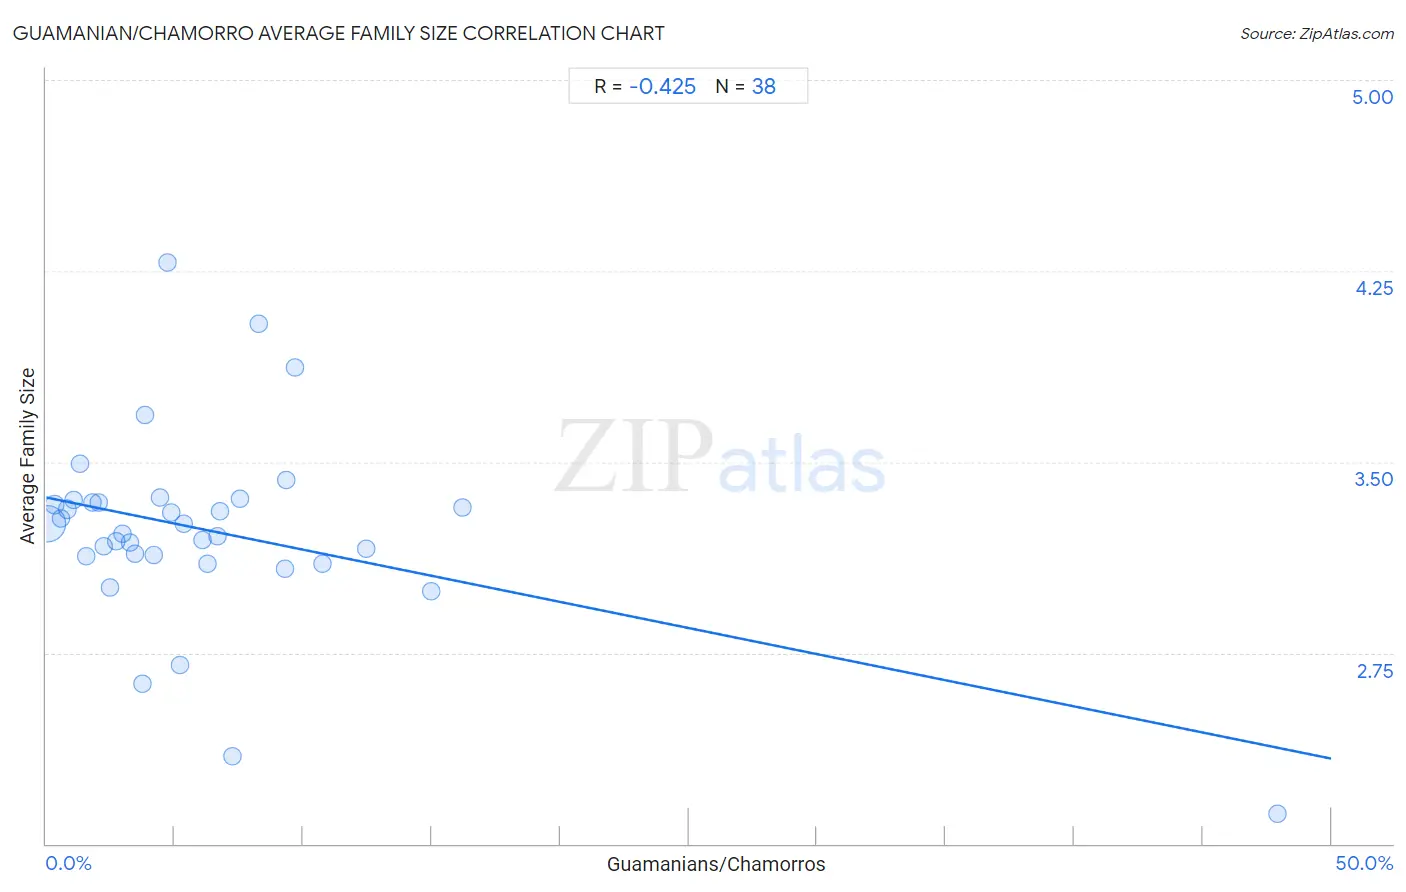
Guamanian/Chamorro Average Family Size Correlation Chart
The statistical analysis conducted on geographies consisting of 221,865,945 people shows a moderate negative correlation between the proportion of Guamanians/Chamorros and average family size in the United States with a correlation coefficient (R) of -0.425 and weighted average of 3.29. On average, for every 1% (one percent) increase in Guamanians/Chamorros within a typical geography, there is a decrease of 0.02 in average family size.
It is essential to understand that the correlation between the percentage of Guamanians/Chamorros and average family size does not imply a direct cause-and-effect relationship. It remains uncertain whether the presence of Guamanians/Chamorros influences an upward or downward trend in the level of average family size within an area, or if Guamanians/Chamorros simply ended up residing in those areas with higher or lower levels of average family size due to other factors.
Demographics Similar to Guamanians/Chamorros by Average Family Size
In terms of average family size, the demographic groups most similar to Guamanians/Chamorros are Immigrants from Oceania (3.29, a difference of 0.010%), Barbadian (3.29, a difference of 0.010%), Nigerian (3.29, a difference of 0.010%), Immigrants from Burma/Myanmar (3.29, a difference of 0.020%), and West Indian (3.29, a difference of 0.020%).
| Demographics | Rating | Rank | Average Family Size |
| Peruvians | 99.2 /100 | #93 | Exceptional 3.30 |
| Sierra Leoneans | 99.0 /100 | #94 | Exceptional 3.30 |
| Immigrants from Lebanon | 99.0 /100 | #95 | Exceptional 3.30 |
| U.S. Virgin Islanders | 98.8 /100 | #96 | Exceptional 3.29 |
| Immigrants from Oceania | 98.7 /100 | #97 | Exceptional 3.29 |
| Barbadians | 98.6 /100 | #98 | Exceptional 3.29 |
| Nigerians | 98.6 /100 | #99 | Exceptional 3.29 |
| Guamanians/Chamorros | 98.6 /100 | #100 | Exceptional 3.29 |
| Immigrants from Burma/Myanmar | 98.6 /100 | #101 | Exceptional 3.29 |
| West Indians | 98.5 /100 | #102 | Exceptional 3.29 |
| Immigrants from Western Africa | 98.4 /100 | #103 | Exceptional 3.29 |
| Bolivians | 98.3 /100 | #104 | Exceptional 3.29 |
| Immigrants from Ghana | 98.1 /100 | #105 | Exceptional 3.29 |
| Paiute | 98.0 /100 | #106 | Exceptional 3.29 |
| Ghanaians | 98.0 /100 | #107 | Exceptional 3.29 |
Guamanian/Chamorro Average Family Size Correlation Summary
| Measurement | Guamanian/Chamorro Data | Average Family Size Data |
| Minimum | 0.066% | 2.12 |
| Maximum | 47.9% | 4.28 |
| Range | 47.8% | 2.16 |
| Mean | 6.4% | 3.23 |
| Median | 4.6% | 3.24 |
| Interquartile 25% (IQ1) | 2.2% | 3.13 |
| Interquartile 75% (IQ3) | 7.5% | 3.34 |
| Interquartile Range (IQR) | 5.3% | 0.21 |
| Standard Deviation (Sample) | 8.0% | 0.38 |
| Standard Deviation (Population) | 7.9% | 0.38 |
Correlation Details
| Guamanian/Chamorro Percentile | Sample Size | Average Family Size |
[ 0.0% - 0.5% ] 0.066% | 190,834,572 | 3.26 |
[ 0.0% - 0.5% ] 0.33% | 20,052,125 | 3.33 |
[ 0.5% - 1.0% ] 0.58% | 5,624,046 | 3.28 |
[ 0.5% - 1.0% ] 0.82% | 2,549,885 | 3.31 |
[ 1.0% - 1.5% ] 1.08% | 1,256,534 | 3.35 |
[ 1.0% - 1.5% ] 1.29% | 477,459 | 3.49 |
[ 1.5% - 2.0% ] 1.54% | 409,375 | 3.13 |
[ 1.5% - 2.0% ] 1.78% | 203,350 | 3.34 |
[ 2.0% - 2.5% ] 2.04% | 135,549 | 3.34 |
[ 2.0% - 2.5% ] 2.22% | 66,564 | 3.17 |
[ 2.0% - 2.5% ] 2.49% | 49,703 | 3.01 |
[ 2.5% - 3.0% ] 2.74% | 24,712 | 3.19 |
[ 2.5% - 3.0% ] 2.99% | 30,241 | 3.22 |
[ 3.0% - 3.5% ] 3.26% | 27,988 | 3.19 |
[ 3.0% - 3.5% ] 3.45% | 45,984 | 3.14 |
[ 3.5% - 4.0% ] 3.75% | 9,680 | 2.63 |
[ 3.5% - 4.0% ] 3.86% | 4,608 | 3.68 |
[ 4.0% - 4.5% ] 4.19% | 7,782 | 3.13 |
[ 4.0% - 4.5% ] 4.41% | 5,379 | 3.36 |
[ 4.5% - 5.0% ] 4.72% | 25,535 | 4.28 |
[ 4.5% - 5.0% ] 4.88% | 3,748 | 3.30 |
[ 5.0% - 5.5% ] 5.22% | 1,974 | 2.70 |
[ 5.0% - 5.5% ] 5.36% | 261 | 3.26 |
[ 6.0% - 6.5% ] 6.07% | 4,758 | 3.19 |
[ 6.0% - 6.5% ] 6.27% | 1,642 | 3.10 |
[ 6.5% - 7.0% ] 6.65% | 857 | 3.21 |
[ 6.5% - 7.0% ] 6.77% | 1,388 | 3.31 |
[ 7.0% - 7.5% ] 7.27% | 1,211 | 2.34 |
[ 7.5% - 8.0% ] 7.55% | 1,669 | 3.36 |
[ 8.0% - 8.5% ] 8.29% | 5,262 | 4.04 |
[ 9.0% - 9.5% ] 9.30% | 172 | 3.08 |
[ 9.0% - 9.5% ] 9.34% | 578 | 3.43 |
[ 9.5% - 10.0% ] 9.70% | 402 | 3.87 |
[ 10.5% - 11.0% ] 10.74% | 121 | 3.10 |
[ 12.0% - 12.5% ] 12.46% | 313 | 3.16 |
[ 14.5% - 15.0% ] 14.97% | 294 | 2.99 |
[ 16.0% - 16.5% ] 16.19% | 105 | 3.32 |
[ 47.5% - 48.0% ] 47.90% | 119 | 2.12 |