Guamanian/Chamorro Single Mother Poverty

COMPARE

Guamanian/Chamorro
Race
Ancestry
AfghanAfricanAlaska NativeAlaskan AthabascanAlbanianAleutAlsatianAmericanApacheArabArapahoArgentineanArmenianAssyrian/Chaldean/SyriacAustralianAustrianBahamianBangladeshiBarbadianBasqueBelgianBelizeanBermudanBhutaneseBlackfeetBolivianBrazilianBritishBritish West IndianBulgarianBurmeseCajunCambodianCanadianCape VerdeanCarpatho RusynCelticCentral AmericanCentral American IndianCherokeeCheyenneChickasawChileanChineseChippewaChoctawColombianColvilleComancheCosta RicanCreeCreekCroatianCrowCubanCypriotCzechCzechoslovakianDanishDelawareDominicanDutchDutch West IndianEastern EuropeanEcuadorianEgyptianEnglishEstonianEthiopianEuropeanFijianFilipinoFinnishFrenchFrench American IndianFrench CanadianGermanGerman RussianGhanaianGreekGuamanian/ChamorroGuatemalanGuyaneseHaitianHmongHonduranHopiHoumaHungarianIcelanderIndian (Asian)IndonesianInupiatIranianIraqiIrishIroquoisIsraeliItalianJamaicanJapaneseJordanianKenyanKiowaKoreanLaotianLatvianLebaneseLiberianLithuanianLumbeeLuxembourgerMacedonianMalaysianMalteseMarshalleseMenomineeMexicanMexican American IndianMongolianMoroccanNative HawaiianNavajoNepaleseNew ZealanderNicaraguanNigerianNorthern EuropeanNorwegianOkinawanOsageOttawaPaiutePakistaniPalestinianPanamanianParaguayanPennsylvania GermanPeruvianPimaPolishPortuguesePotawatomiPuebloPuerto RicanPuget Sound SalishRomanianRussianSalvadoranSamoanScandinavianScotch-IrishScottishSeminoleSenegaleseSerbianShoshoneSierra LeoneanSiouxSlavicSlovakSloveneSomaliSouth AfricanSouth AmericanSouth American IndianSoviet UnionSpaniardSpanishSpanish AmericanSpanish American IndianSri LankanSubsaharan AfricanSudaneseSwedishSwissSyrianTaiwaneseThaiTlingit-HaidaTohono O'OdhamTonganTrinidadian and TobagonianTsimshianTurkishU.S. Virgin IslanderUgandanUkrainianUruguayanUteVenezuelanVietnameseWelshWest IndianYakamaYaquiYugoslavianYumanYup'ikZimbabwean
Immigration
NonimmigrantsImmigrantsAfghanistanAfricaAlbaniaArgentinaArmeniaAsiaAustraliaAustriaBahamasBangladeshBarbadosBelarusBelgiumBelizeBoliviaBosnia and HerzegovinaBrazilBulgariaBurma/MyanmarCabo VerdeCambodiaCameroonCanadaCaribbeanCentral AmericaChileChinaColombiaCongoCosta RicaCroatiaCubaCzechoslovakiaDenmarkDominicaDominican RepublicEastern AfricaEastern AsiaEastern EuropeEcuadorEgyptEl SalvadorEnglandEritreaEthiopiaEuropeFijiFranceGermanyGhanaGreeceGrenadaGuatemalaGuyanaHaitiHondurasHong KongHungaryIndiaIndonesiaIranIraqIrelandIsraelItalyJamaicaJapanJordanKazakhstanKenyaKoreaKuwaitLaosLatin AmericaLatviaLebanonLiberiaLithuaniaMalaysiaMexicoMicronesiaMiddle AfricaMoldovaMoroccoNepalNetherlandsNicaraguaNigeriaNorth AmericaNorth MacedoniaNorthern AfricaNorthern EuropeNorwayOceaniaPakistanPanamaPeruPhilippinesPolandPortugalRomaniaRussiaSaudi ArabiaScotlandSenegalSerbiaSierra LeoneSingaporeSomaliaSouth AfricaSouth AmericaSouth Central AsiaSouth Eastern AsiaSouthern EuropeSpainSri LankaSt. Vincent and the GrenadinesSudanSwedenSwitzerlandSyriaTaiwanThailandTrinidad and TobagoTurkeyUgandaUkraineUruguayUzbekistanVenezuelaVietnamWest IndiesWestern AfricaWestern AsiaWestern EuropeYemenZaireZimbabweAzores
Select to Compare
Race
Ancestry
AfghanAfricanAlaska NativeAlaskan AthabascanAlbanianAleutAlsatianAmericanApacheArabArapahoArgentineanArmenianAssyrian/Chaldean/SyriacAustralianAustrianBahamianBangladeshiBarbadianBasqueBelgianBelizeanBermudanBhutaneseBlackfeetBolivianBrazilianBritishBritish West IndianBulgarianBurmeseCajunCambodianCanadianCape VerdeanCarpatho RusynCelticCentral AmericanCentral American IndianCherokeeCheyenneChickasawChileanChineseChippewaChoctawColombianColvilleComancheCosta RicanCreeCreekCroatianCrowCubanCypriotCzechCzechoslovakianDanishDelawareDominicanDutchDutch West IndianEastern EuropeanEcuadorianEgyptianEnglishEstonianEthiopianEuropeanFijianFilipinoFinnishFrenchFrench American IndianFrench CanadianGermanGerman RussianGhanaianGreekGuatemalanGuyaneseHaitianHmongHonduranHopiHoumaHungarianIcelanderIndian (Asian)IndonesianInupiatIranianIraqiIrishIroquoisIsraeliItalianJamaicanJapaneseJordanianKenyanKiowaKoreanLaotianLatvianLebaneseLiberianLithuanianLumbeeLuxembourgerMacedonianMalaysianMalteseMarshalleseMenomineeMexicanMexican American IndianMongolianMoroccanNative HawaiianNavajoNepaleseNew ZealanderNicaraguanNigerianNorthern EuropeanNorwegianOkinawanOsageOttawaPaiutePakistaniPalestinianPanamanianParaguayanPennsylvania GermanPeruvianPimaPolishPortuguesePotawatomiPuebloPuerto RicanPuget Sound SalishRomanianRussianSalvadoranSamoanScandinavianScotch-IrishScottishSeminoleSenegaleseSerbianShoshoneSierra LeoneanSiouxSlavicSlovakSloveneSomaliSouth AfricanSouth AmericanSouth American IndianSoviet UnionSpaniardSpanishSpanish AmericanSpanish American IndianSri LankanSubsaharan AfricanSudaneseSwedishSwissSyrianTaiwaneseThaiTlingit-HaidaTohono O'OdhamTonganTrinidadian and TobagonianTsimshianTurkishU.S. Virgin IslanderUgandanUkrainianUruguayanUteVenezuelanVietnameseWelshWest IndianYakamaYaquiYugoslavianYumanYup'ikZimbabwean
Immigration
NonimmigrantsImmigrantsAfghanistanAfricaAlbaniaArgentinaArmeniaAsiaAustraliaAustriaBahamasBangladeshBarbadosBelarusBelgiumBelizeBoliviaBosnia and HerzegovinaBrazilBulgariaBurma/MyanmarCabo VerdeCambodiaCameroonCanadaCaribbeanCentral AmericaChileChinaColombiaCongoCosta RicaCroatiaCubaCzechoslovakiaDenmarkDominicaDominican RepublicEastern AfricaEastern AsiaEastern EuropeEcuadorEgyptEl SalvadorEnglandEritreaEthiopiaEuropeFijiFranceGermanyGhanaGreeceGrenadaGuatemalaGuyanaHaitiHondurasHong KongHungaryIndiaIndonesiaIranIraqIrelandIsraelItalyJamaicaJapanJordanKazakhstanKenyaKoreaKuwaitLaosLatin AmericaLatviaLebanonLiberiaLithuaniaMalaysiaMexicoMicronesiaMiddle AfricaMoldovaMoroccoNepalNetherlandsNicaraguaNigeriaNorth AmericaNorth MacedoniaNorthern AfricaNorthern EuropeNorwayOceaniaPakistanPanamaPeruPhilippinesPolandPortugalRomaniaRussiaSaudi ArabiaScotlandSenegalSerbiaSierra LeoneSingaporeSomaliaSouth AfricaSouth AmericaSouth Central AsiaSouth Eastern AsiaSouthern EuropeSpainSri LankaSt. Vincent and the GrenadinesSudanSwedenSwitzerlandSyriaTaiwanThailandTrinidad and TobagoTurkeyUgandaUkraineUruguayUzbekistanVenezuelaVietnamWest IndiesWestern AfricaWestern AsiaWestern EuropeYemenZaireZimbabweAzores
Single Mother Poverty
Income
Poverty
Unemployment
Labor Participation
Family Structure
Vehicle Availability
Education Level
Disability

Guamanian/Chamorro Single Mother Poverty
Fair

29.4%
POVERTY | SINGLE MOTHERS
31.8/ 100
METRIC RATING
188th/ 347
METRIC RANK

Guamanian/Chamorro Single Mother Poverty Correlation Chart

The statistical analysis conducted on geographies consisting of 219,675,506 people shows a substantial positive correlation between the proportion of Guamanians/Chamorros and poverty level among single mothers in the United States with a correlation coefficient (R) of 0.579 and weighted average of 29.4%. On average, for every 1% (one percent) increase in Guamanians/Chamorros within a typical geography, there is an increase of 1.6% in poverty level among single mothers.
Guamanian/Chamorro Single Mother Poverty
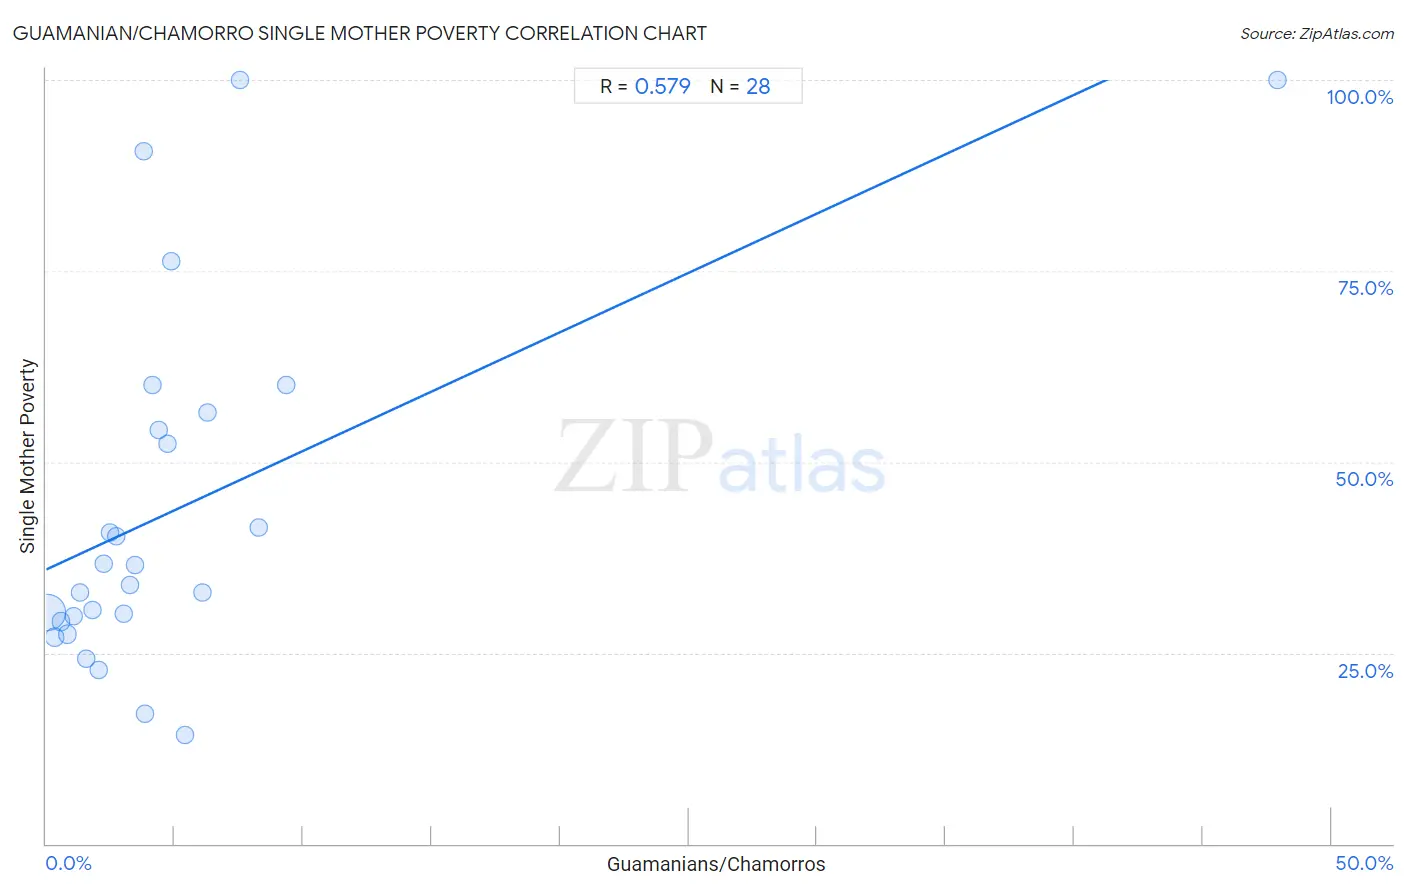
It is essential to understand that the correlation between the percentage of Guamanians/Chamorros and poverty level among single mothers does not imply a direct cause-and-effect relationship. It remains uncertain whether the presence of Guamanians/Chamorros influences an upward or downward trend in the level of poverty level among single mothers within an area, or if Guamanians/Chamorros simply ended up residing in those areas with higher or lower levels of poverty level among single mothers due to other factors.

Demographics Similar to Guamanians/Chamorros by Single Mother Poverty

In terms of single mother poverty, the demographic groups most similar to Guamanians/Chamorros are Immigrants from Africa (29.4%, a difference of 0.010%), Lebanese (29.4%, a difference of 0.040%), Immigrants from Germany (29.5%, a difference of 0.070%), Immigrants from Trinidad and Tobago (29.5%, a difference of 0.14%), and Moroccan (29.5%, a difference of 0.18%).
DemographicsRating | RankSingle Mother Poverty
Canadians
40.4
/100
|
#181
Average
29.3%
Immigrants from Eastern Africa
38.5
/100
|
#182
Fair
29.3%
Nepalese
38.3
/100
|
#183
Fair
29.3%
Nigerians
38.0
/100
|
#184
Fair
29.3%
Ghanaians
36.8
/100
|
#185
Fair
29.4%
Yugoslavians
36.0
/100
|
#186
Fair
29.4%
Lebanese
32.5
/100
|
#187
Fair
29.4%
Guamanians/Chamorros
31.8
/100
|
#188
Fair
29.4%
Immigrants from Africa
31.6
/100
|
#189
Fair
29.4%
Immigrants from Germany
30.4
/100
|
#190
Fair
29.5%
Immigrants from Trinidad and Tobago
29.2
/100
|
#191
Fair
29.5%
Moroccans
28.6
/100
|
#192
Fair
29.5%
Basques
28.3
/100
|
#193
Fair
29.5%
Icelanders
26.1
/100
|
#194
Fair
29.5%
Slavs
24.5
/100
|
#195
Fair
29.6%

Guamanian/Chamorro Single Mother Poverty Correlation Summary

MeasurementGuamanian/Chamorro DataSingle Mother Poverty Data
Minimum0.065%14.3%
Maximum47.9%100.0%
Range47.8%85.7%
Mean5.1%43.9%
Median3.3%35.2%
Interquartile 25% (IQ1)1.7%29.4%
Interquartile 75% (IQ3)5.1%55.3%
Interquartile Range (IQR)3.5%25.8%
Standard Deviation (Sample)8.7%23.4%
Standard Deviation (Population)8.6%23.0%

Correlation Details

Guamanian/Chamorro PercentileSample SizeSingle Mother Poverty
[
0.0%
-
0.5%
]
0.065%
189,464,48730.3%
[
0.0%
-
0.5%
]
0.33%
19,668,44627.0%
[
0.5%
-
1.0%
]
0.58%
5,432,81829.1%
[
0.5%
-
1.0%
]
0.82%
2,512,43627.4%
[
1.0%
-
1.5%
]
1.08%
1,188,15229.8%
[
1.0%
-
1.5%
]
1.29%
437,82032.9%
[
1.5%
-
2.0%
]
1.55%
377,45224.3%
[
1.5%
-
2.0%
]
1.78%
188,21430.5%
[
2.0%
-
2.5%
]
2.05%
131,91022.8%
[
2.0%
-
2.5%
]
2.22%
63,25336.7%
[
2.5%
-
3.0%
]
2.50%
41,68840.8%
[
2.5%
-
3.0%
]
2.73%
18,14340.2%
[
3.0%
-
3.5%
]
3.00%
25,50430.1%
[
3.0%
-
3.5%
]
3.26%
27,20433.9%
[
3.0%
-
3.5%
]
3.44%
41,98936.5%
[
3.5%
-
4.0%
]
3.78%
6,96590.7%
[
3.5%
-
4.0%
]
3.87%
4,24317.0%
[
4.0%
-
4.5%
]
4.14%
4,80460.0%
[
4.0%
-
4.5%
]
4.40%
4,23054.2%
[
4.5%
-
5.0%
]
4.73%
17,81752.3%
[
4.5%
-
5.0%
]
4.88%
3,74876.2%
[
5.0%
-
5.5%
]
5.38%
18614.3%
[
6.0%
-
6.5%
]
6.07%
4,75832.9%
[
6.0%
-
6.5%
]
6.27%
1,61156.4%
[
7.5%
-
8.0%
]
7.55%
1,669100.0%
[
8.0%
-
8.5%
]
8.29%
5,26241.4%
[
9.0%
-
9.5%
]
9.34%
57860.0%
[
47.5%
-
48.0%
]
47.90%
119100.0%