Guamanian/Chamorro No Schooling Completed
COMPARE
Guamanian/Chamorro
Select to Compare
No Schooling Completed
Guamanian/Chamorro No Schooling Completed
2.2%
NO SCHOOLING
29.8/ 100
METRIC RATING
192nd/ 347
METRIC RANK
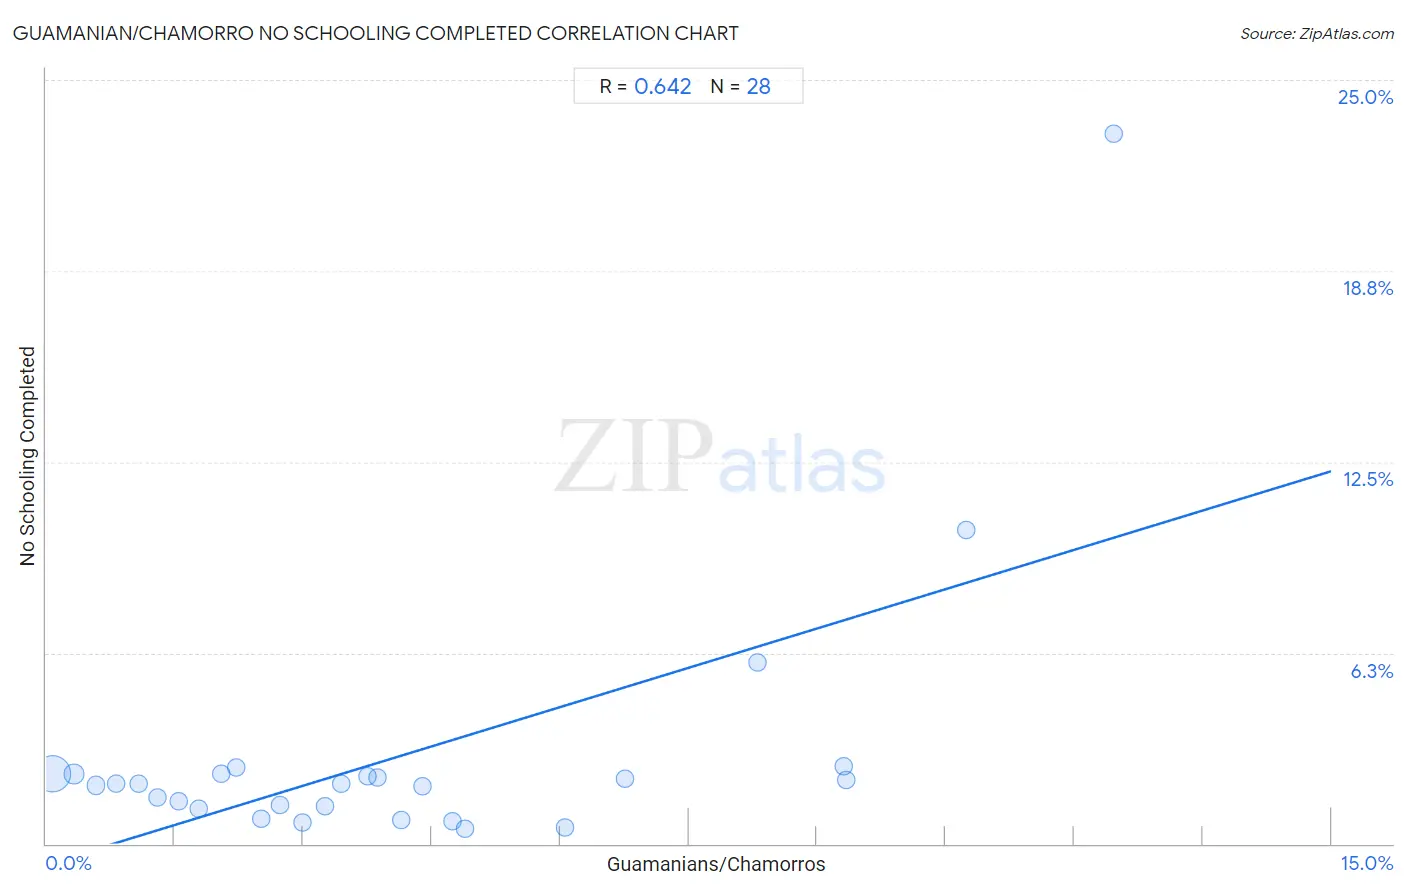
Guamanian/Chamorro No Schooling Completed Correlation Chart
The statistical analysis conducted on geographies consisting of 220,951,365 people shows a significant positive correlation between the proportion of Guamanians/Chamorros and percentage of population with no schooling in the United States with a correlation coefficient (R) of 0.642 and weighted average of 2.2%. On average, for every 1% (one percent) increase in Guamanians/Chamorros within a typical geography, there is an increase of 0.86% in percentage of population with no schooling.
It is essential to understand that the correlation between the percentage of Guamanians/Chamorros and percentage of population with no schooling does not imply a direct cause-and-effect relationship. It remains uncertain whether the presence of Guamanians/Chamorros influences an upward or downward trend in the level of percentage of population with no schooling within an area, or if Guamanians/Chamorros simply ended up residing in those areas with higher or lower levels of percentage of population with no schooling due to other factors.
Demographics Similar to Guamanians/Chamorros by No Schooling Completed
In terms of no schooling completed, the demographic groups most similar to Guamanians/Chamorros are Paraguayan (2.2%, a difference of 0.080%), Bermudan (2.1%, a difference of 0.14%), Immigrants from Albania (2.2%, a difference of 0.24%), Spanish American (2.1%, a difference of 0.43%), and Hawaiian (2.2%, a difference of 0.44%).
| Demographics | Rating | Rank | No Schooling Completed |
| Mongolians | 40.8 /100 | #185 | Average 2.1% |
| Immigrants from Bosnia and Herzegovina | 38.6 /100 | #186 | Fair 2.1% |
| Navajo | 36.5 /100 | #187 | Fair 2.1% |
| Immigrants from Kenya | 36.2 /100 | #188 | Fair 2.1% |
| Immigrants from Egypt | 36.1 /100 | #189 | Fair 2.1% |
| Spanish Americans | 32.6 /100 | #190 | Fair 2.1% |
| Bermudans | 30.7 /100 | #191 | Fair 2.1% |
| Guamanians/Chamorros | 29.8 /100 | #192 | Fair 2.2% |
| Paraguayans | 29.3 /100 | #193 | Fair 2.2% |
| Immigrants from Albania | 28.3 /100 | #194 | Fair 2.2% |
| Hawaiians | 27.0 /100 | #195 | Fair 2.2% |
| Immigrants from Ukraine | 26.1 /100 | #196 | Fair 2.2% |
| Immigrants from Southern Europe | 23.8 /100 | #197 | Fair 2.2% |
| Immigrants from Chile | 22.7 /100 | #198 | Fair 2.2% |
| Africans | 21.8 /100 | #199 | Fair 2.2% |
Guamanian/Chamorro No Schooling Completed Correlation Summary
| Measurement | Guamanian/Chamorro Data | No Schooling Completed Data |
| Minimum | 0.066% | 0.47% |
| Maximum | 12.5% | 23.2% |
| Range | 12.4% | 22.8% |
| Mean | 4.1% | 2.9% |
| Median | 3.4% | 2.0% |
| Interquartile 25% (IQ1) | 1.7% | 1.2% |
| Interquartile 75% (IQ3) | 5.5% | 2.3% |
| Interquartile Range (IQR) | 3.8% | 1.1% |
| Standard Deviation (Sample) | 3.3% | 4.4% |
| Standard Deviation (Population) | 3.2% | 4.3% |
Correlation Details
| Guamanian/Chamorro Percentile | Sample Size | No Schooling Completed |
[ 0.0% - 0.5% ] 0.066% | 190,471,830 | 2.3% |
[ 0.0% - 0.5% ] 0.33% | 19,888,789 | 2.3% |
[ 0.5% - 1.0% ] 0.58% | 5,480,369 | 1.9% |
[ 0.5% - 1.0% ] 0.82% | 2,486,962 | 2.0% |
[ 1.0% - 1.5% ] 1.08% | 1,217,338 | 2.0% |
[ 1.0% - 1.5% ] 1.30% | 448,710 | 1.5% |
[ 1.5% - 2.0% ] 1.54% | 392,392 | 1.4% |
[ 1.5% - 2.0% ] 1.78% | 188,404 | 1.1% |
[ 2.0% - 2.5% ] 2.04% | 130,878 | 2.3% |
[ 2.0% - 2.5% ] 2.22% | 60,762 | 2.5% |
[ 2.5% - 3.0% ] 2.51% | 35,385 | 0.84% |
[ 2.5% - 3.0% ] 2.73% | 15,904 | 1.2% |
[ 2.5% - 3.0% ] 2.99% | 19,458 | 0.68% |
[ 3.0% - 3.5% ] 3.26% | 27,988 | 1.2% |
[ 3.0% - 3.5% ] 3.45% | 34,305 | 1.9% |
[ 3.5% - 4.0% ] 3.75% | 8,180 | 2.2% |
[ 3.5% - 4.0% ] 3.87% | 2,299 | 2.2% |
[ 4.0% - 4.5% ] 4.15% | 5,014 | 0.78% |
[ 4.0% - 4.5% ] 4.40% | 4,410 | 1.9% |
[ 4.5% - 5.0% ] 4.74% | 19,434 | 0.75% |
[ 4.5% - 5.0% ] 4.88% | 3,748 | 0.47% |
[ 6.0% - 6.5% ] 6.05% | 2,115 | 0.54% |
[ 6.5% - 7.0% ] 6.75% | 859 | 2.1% |
[ 8.0% - 8.5% ] 8.30% | 4,648 | 5.9% |
[ 9.0% - 9.5% ] 9.30% | 172 | 2.5% |
[ 9.0% - 9.5% ] 9.34% | 578 | 2.1% |
[ 10.5% - 11.0% ] 10.74% | 121 | 10.3% |
[ 12.0% - 12.5% ] 12.46% | 313 | 23.2% |