Guamanian/Chamorro Currently Married
COMPARE
Guamanian/Chamorro
Select to Compare
Currently Married
Guamanian/Chamorro Currently Married
47.1%
CURRENTLY MARRIED
74.2/ 100
METRIC RATING
143rd/ 347
METRIC RANK
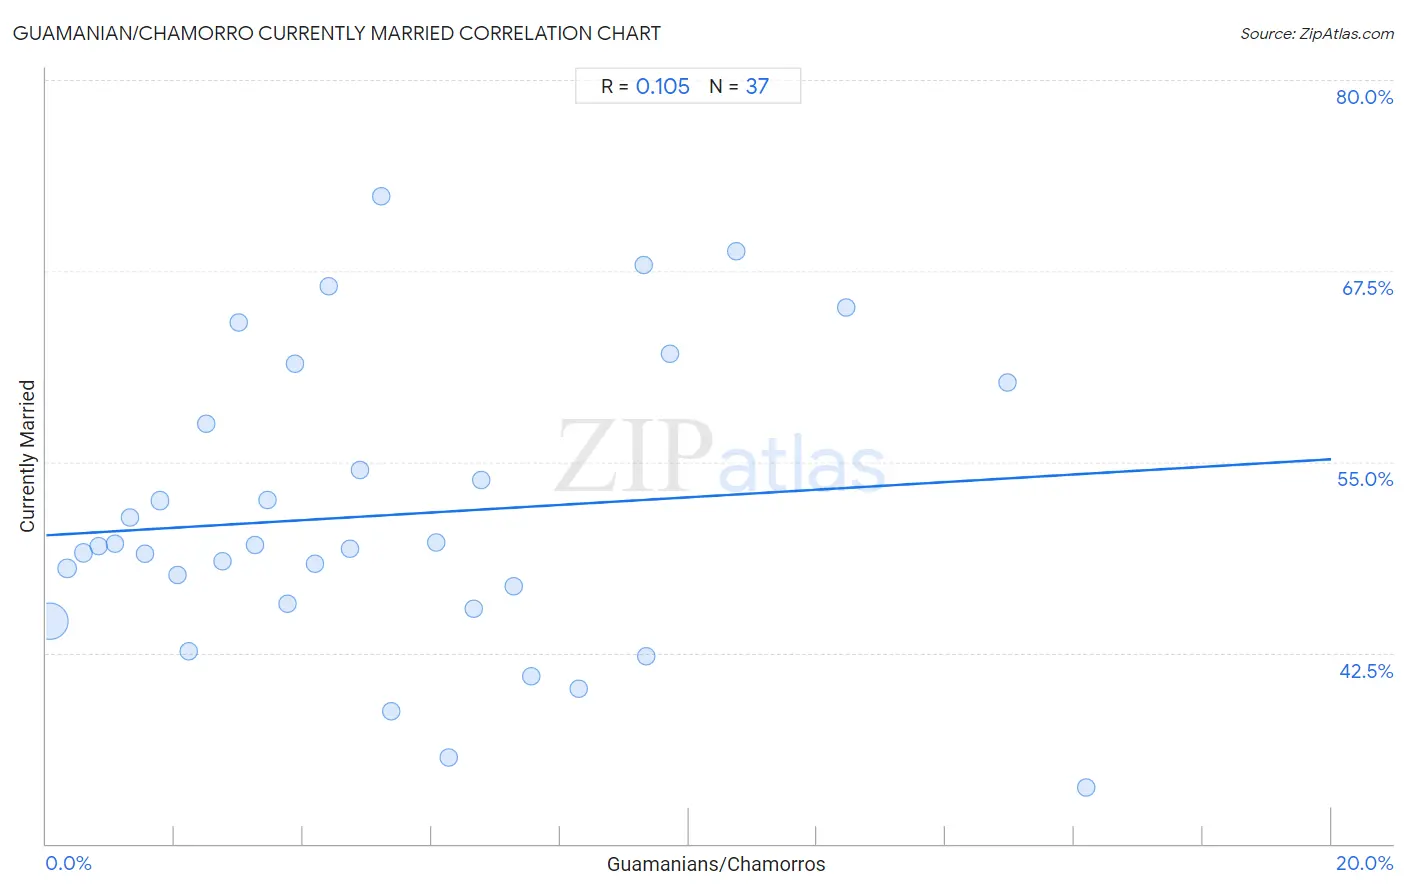
Guamanian/Chamorro Currently Married Correlation Chart
The statistical analysis conducted on geographies consisting of 221,951,395 people shows a poor positive correlation between the proportion of Guamanians/Chamorros and percentage of population currently married in the United States with a correlation coefficient (R) of 0.105 and weighted average of 47.1%. On average, for every 1% (one percent) increase in Guamanians/Chamorros within a typical geography, there is an increase of 0.25% in percentage of population currently married.
It is essential to understand that the correlation between the percentage of Guamanians/Chamorros and percentage of population currently married does not imply a direct cause-and-effect relationship. It remains uncertain whether the presence of Guamanians/Chamorros influences an upward or downward trend in the level of percentage of population currently married within an area, or if Guamanians/Chamorros simply ended up residing in those areas with higher or lower levels of percentage of population currently married due to other factors.
Demographics Similar to Guamanians/Chamorros by Currently Married
In terms of currently married, the demographic groups most similar to Guamanians/Chamorros are Venezuelan (47.1%, a difference of 0.010%), Argentinean (47.1%, a difference of 0.010%), Hmong (47.1%, a difference of 0.040%), Cajun (47.1%, a difference of 0.050%), and Immigrants from South Eastern Asia (47.1%, a difference of 0.060%).
| Demographics | Rating | Rank | Currently Married |
| Immigrants from Vietnam | 78.2 /100 | #136 | Good 47.2% |
| Paraguayans | 77.8 /100 | #137 | Good 47.2% |
| Pakistanis | 77.5 /100 | #138 | Good 47.2% |
| Yugoslavians | 77.4 /100 | #139 | Good 47.2% |
| Cajuns | 75.3 /100 | #140 | Good 47.1% |
| Venezuelans | 74.4 /100 | #141 | Good 47.1% |
| Argentineans | 74.4 /100 | #142 | Good 47.1% |
| Guamanians/Chamorros | 74.2 /100 | #143 | Good 47.1% |
| Hmong | 73.4 /100 | #144 | Good 47.1% |
| Immigrants from South Eastern Asia | 72.9 /100 | #145 | Good 47.1% |
| Carpatho Rusyns | 72.6 /100 | #146 | Good 47.0% |
| Immigrants from Argentina | 72.0 /100 | #147 | Good 47.0% |
| Cambodians | 70.4 /100 | #148 | Good 47.0% |
| Zimbabweans | 70.1 /100 | #149 | Good 47.0% |
| Immigrants from Turkey | 70.0 /100 | #150 | Good 47.0% |
Guamanian/Chamorro Currently Married Correlation Summary
| Measurement | Guamanian/Chamorro Data | Currently Married Data |
| Minimum | 0.066% | 33.7% |
| Maximum | 16.2% | 72.4% |
| Range | 16.1% | 38.7% |
| Mean | 5.3% | 51.5% |
| Median | 4.4% | 49.5% |
| Interquartile 25% (IQ1) | 2.1% | 45.6% |
| Interquartile 75% (IQ3) | 7.4% | 58.9% |
| Interquartile Range (IQR) | 5.3% | 13.3% |
| Standard Deviation (Sample) | 4.0% | 9.5% |
| Standard Deviation (Population) | 3.9% | 9.4% |
Correlation Details
| Guamanian/Chamorro Percentile | Sample Size | Currently Married |
[ 0.0% - 0.5% ] 0.066% | 190,862,982 | 44.6% |
[ 0.0% - 0.5% ] 0.33% | 20,073,933 | 48.0% |
[ 0.5% - 1.0% ] 0.58% | 5,638,920 | 49.0% |
[ 0.5% - 1.0% ] 0.82% | 2,559,515 | 49.5% |
[ 1.0% - 1.5% ] 1.08% | 1,257,939 | 49.6% |
[ 1.0% - 1.5% ] 1.29% | 482,955 | 51.3% |
[ 1.5% - 2.0% ] 1.54% | 411,419 | 49.0% |
[ 1.5% - 2.0% ] 1.78% | 203,350 | 52.5% |
[ 2.0% - 2.5% ] 2.04% | 135,549 | 47.6% |
[ 2.0% - 2.5% ] 2.22% | 66,564 | 42.6% |
[ 2.0% - 2.5% ] 2.49% | 49,703 | 57.5% |
[ 2.5% - 3.0% ] 2.74% | 25,519 | 48.5% |
[ 2.5% - 3.0% ] 2.99% | 30,241 | 64.1% |
[ 3.0% - 3.5% ] 3.26% | 27,988 | 49.6% |
[ 3.0% - 3.5% ] 3.45% | 45,984 | 52.5% |
[ 3.5% - 4.0% ] 3.75% | 10,775 | 45.7% |
[ 3.5% - 4.0% ] 3.86% | 4,608 | 61.5% |
[ 4.0% - 4.5% ] 4.19% | 7,782 | 48.3% |
[ 4.0% - 4.5% ] 4.41% | 5,379 | 66.5% |
[ 4.5% - 5.0% ] 4.72% | 25,535 | 49.3% |
[ 4.5% - 5.0% ] 4.88% | 3,748 | 54.5% |
[ 5.0% - 5.5% ] 5.22% | 1,974 | 72.4% |
[ 5.0% - 5.5% ] 5.36% | 261 | 38.6% |
[ 6.0% - 6.5% ] 6.07% | 4,758 | 49.7% |
[ 6.0% - 6.5% ] 6.27% | 1,642 | 35.6% |
[ 6.5% - 7.0% ] 6.65% | 857 | 45.4% |
[ 6.5% - 7.0% ] 6.77% | 1,388 | 53.8% |
[ 7.0% - 7.5% ] 7.27% | 1,211 | 46.9% |
[ 7.5% - 8.0% ] 7.55% | 1,669 | 41.0% |
[ 8.0% - 8.5% ] 8.29% | 5,262 | 40.2% |
[ 9.0% - 9.5% ] 9.30% | 172 | 67.9% |
[ 9.0% - 9.5% ] 9.34% | 578 | 42.3% |
[ 9.5% - 10.0% ] 9.70% | 402 | 62.1% |
[ 10.5% - 11.0% ] 10.74% | 121 | 68.8% |
[ 12.0% - 12.5% ] 12.46% | 313 | 65.1% |
[ 14.5% - 15.0% ] 14.97% | 294 | 60.2% |
[ 16.0% - 16.5% ] 16.19% | 105 | 33.7% |