Guamanian/Chamorro Per Capita Income

COMPARE

Guamanian/Chamorro
Race
Ancestry
AfghanAfricanAlaska NativeAlaskan AthabascanAlbanianAleutAlsatianAmericanApacheArabArapahoArgentineanArmenianAssyrian/Chaldean/SyriacAustralianAustrianBahamianBangladeshiBarbadianBasqueBelgianBelizeanBermudanBhutaneseBlackfeetBolivianBrazilianBritishBritish West IndianBulgarianBurmeseCajunCambodianCanadianCape VerdeanCarpatho RusynCelticCentral AmericanCentral American IndianCherokeeCheyenneChickasawChileanChineseChippewaChoctawColombianColvilleComancheCosta RicanCreeCreekCroatianCrowCubanCypriotCzechCzechoslovakianDanishDelawareDominicanDutchDutch West IndianEastern EuropeanEcuadorianEgyptianEnglishEstonianEthiopianEuropeanFijianFilipinoFinnishFrenchFrench American IndianFrench CanadianGermanGerman RussianGhanaianGreekGuamanian/ChamorroGuatemalanGuyaneseHaitianHmongHonduranHopiHoumaHungarianIcelanderIndian (Asian)IndonesianInupiatIranianIraqiIrishIroquoisIsraeliItalianJamaicanJapaneseJordanianKenyanKiowaKoreanLaotianLatvianLebaneseLiberianLithuanianLumbeeLuxembourgerMacedonianMalaysianMalteseMarshalleseMenomineeMexicanMexican American IndianMongolianMoroccanNative HawaiianNavajoNepaleseNew ZealanderNicaraguanNigerianNorthern EuropeanNorwegianOkinawanOsageOttawaPaiutePakistaniPalestinianPanamanianParaguayanPennsylvania GermanPeruvianPimaPolishPortuguesePotawatomiPuebloPuerto RicanPuget Sound SalishRomanianRussianSalvadoranSamoanScandinavianScotch-IrishScottishSeminoleSenegaleseSerbianShoshoneSierra LeoneanSiouxSlavicSlovakSloveneSomaliSouth AfricanSouth AmericanSouth American IndianSoviet UnionSpaniardSpanishSpanish AmericanSpanish American IndianSri LankanSubsaharan AfricanSudaneseSwedishSwissSyrianTaiwaneseThaiTlingit-HaidaTohono O'OdhamTonganTrinidadian and TobagonianTsimshianTurkishU.S. Virgin IslanderUgandanUkrainianUruguayanUteVenezuelanVietnameseWelshWest IndianYakamaYaquiYugoslavianYumanYup'ikZimbabwean
Immigration
NonimmigrantsImmigrantsAfghanistanAfricaAlbaniaArgentinaArmeniaAsiaAustraliaAustriaBahamasBangladeshBarbadosBelarusBelgiumBelizeBoliviaBosnia and HerzegovinaBrazilBulgariaBurma/MyanmarCabo VerdeCambodiaCameroonCanadaCaribbeanCentral AmericaChileChinaColombiaCongoCosta RicaCroatiaCubaCzechoslovakiaDenmarkDominicaDominican RepublicEastern AfricaEastern AsiaEastern EuropeEcuadorEgyptEl SalvadorEnglandEritreaEthiopiaEuropeFijiFranceGermanyGhanaGreeceGrenadaGuatemalaGuyanaHaitiHondurasHong KongHungaryIndiaIndonesiaIranIraqIrelandIsraelItalyJamaicaJapanJordanKazakhstanKenyaKoreaKuwaitLaosLatin AmericaLatviaLebanonLiberiaLithuaniaMalaysiaMexicoMicronesiaMiddle AfricaMoldovaMoroccoNepalNetherlandsNicaraguaNigeriaNorth AmericaNorth MacedoniaNorthern AfricaNorthern EuropeNorwayOceaniaPakistanPanamaPeruPhilippinesPolandPortugalRomaniaRussiaSaudi ArabiaScotlandSenegalSerbiaSierra LeoneSingaporeSomaliaSouth AfricaSouth AmericaSouth Central AsiaSouth Eastern AsiaSouthern EuropeSpainSri LankaSt. Vincent and the GrenadinesSudanSwedenSwitzerlandSyriaTaiwanThailandTrinidad and TobagoTurkeyUgandaUkraineUruguayUzbekistanVenezuelaVietnamWest IndiesWestern AfricaWestern AsiaWestern EuropeYemenZaireZimbabweAzores
Select to Compare
Race
Ancestry
AfghanAfricanAlaska NativeAlaskan AthabascanAlbanianAleutAlsatianAmericanApacheArabArapahoArgentineanArmenianAssyrian/Chaldean/SyriacAustralianAustrianBahamianBangladeshiBarbadianBasqueBelgianBelizeanBermudanBhutaneseBlackfeetBolivianBrazilianBritishBritish West IndianBulgarianBurmeseCajunCambodianCanadianCape VerdeanCarpatho RusynCelticCentral AmericanCentral American IndianCherokeeCheyenneChickasawChileanChineseChippewaChoctawColombianColvilleComancheCosta RicanCreeCreekCroatianCrowCubanCypriotCzechCzechoslovakianDanishDelawareDominicanDutchDutch West IndianEastern EuropeanEcuadorianEgyptianEnglishEstonianEthiopianEuropeanFijianFilipinoFinnishFrenchFrench American IndianFrench CanadianGermanGerman RussianGhanaianGreekGuatemalanGuyaneseHaitianHmongHonduranHopiHoumaHungarianIcelanderIndian (Asian)IndonesianInupiatIranianIraqiIrishIroquoisIsraeliItalianJamaicanJapaneseJordanianKenyanKiowaKoreanLaotianLatvianLebaneseLiberianLithuanianLumbeeLuxembourgerMacedonianMalaysianMalteseMarshalleseMenomineeMexicanMexican American IndianMongolianMoroccanNative HawaiianNavajoNepaleseNew ZealanderNicaraguanNigerianNorthern EuropeanNorwegianOkinawanOsageOttawaPaiutePakistaniPalestinianPanamanianParaguayanPennsylvania GermanPeruvianPimaPolishPortuguesePotawatomiPuebloPuerto RicanPuget Sound SalishRomanianRussianSalvadoranSamoanScandinavianScotch-IrishScottishSeminoleSenegaleseSerbianShoshoneSierra LeoneanSiouxSlavicSlovakSloveneSomaliSouth AfricanSouth AmericanSouth American IndianSoviet UnionSpaniardSpanishSpanish AmericanSpanish American IndianSri LankanSubsaharan AfricanSudaneseSwedishSwissSyrianTaiwaneseThaiTlingit-HaidaTohono O'OdhamTonganTrinidadian and TobagonianTsimshianTurkishU.S. Virgin IslanderUgandanUkrainianUruguayanUteVenezuelanVietnameseWelshWest IndianYakamaYaquiYugoslavianYumanYup'ikZimbabwean
Immigration
NonimmigrantsImmigrantsAfghanistanAfricaAlbaniaArgentinaArmeniaAsiaAustraliaAustriaBahamasBangladeshBarbadosBelarusBelgiumBelizeBoliviaBosnia and HerzegovinaBrazilBulgariaBurma/MyanmarCabo VerdeCambodiaCameroonCanadaCaribbeanCentral AmericaChileChinaColombiaCongoCosta RicaCroatiaCubaCzechoslovakiaDenmarkDominicaDominican RepublicEastern AfricaEastern AsiaEastern EuropeEcuadorEgyptEl SalvadorEnglandEritreaEthiopiaEuropeFijiFranceGermanyGhanaGreeceGrenadaGuatemalaGuyanaHaitiHondurasHong KongHungaryIndiaIndonesiaIranIraqIrelandIsraelItalyJamaicaJapanJordanKazakhstanKenyaKoreaKuwaitLaosLatin AmericaLatviaLebanonLiberiaLithuaniaMalaysiaMexicoMicronesiaMiddle AfricaMoldovaMoroccoNepalNetherlandsNicaraguaNigeriaNorth AmericaNorth MacedoniaNorthern AfricaNorthern EuropeNorwayOceaniaPakistanPanamaPeruPhilippinesPolandPortugalRomaniaRussiaSaudi ArabiaScotlandSenegalSerbiaSierra LeoneSingaporeSomaliaSouth AfricaSouth AmericaSouth Central AsiaSouth Eastern AsiaSouthern EuropeSpainSri LankaSt. Vincent and the GrenadinesSudanSwedenSwitzerlandSyriaTaiwanThailandTrinidad and TobagoTurkeyUgandaUkraineUruguayUzbekistanVenezuelaVietnamWest IndiesWestern AfricaWestern AsiaWestern EuropeYemenZaireZimbabweAzores
Per Capita Income
Income
Poverty
Unemployment
Labor Participation
Family Structure
Vehicle Availability
Education Level
Disability

Guamanian/Chamorro Per Capita Income
Tragic

$41,678
PER CAPITA INCOME
9.7/ 100
METRIC RATING
217th/ 347
METRIC RANK

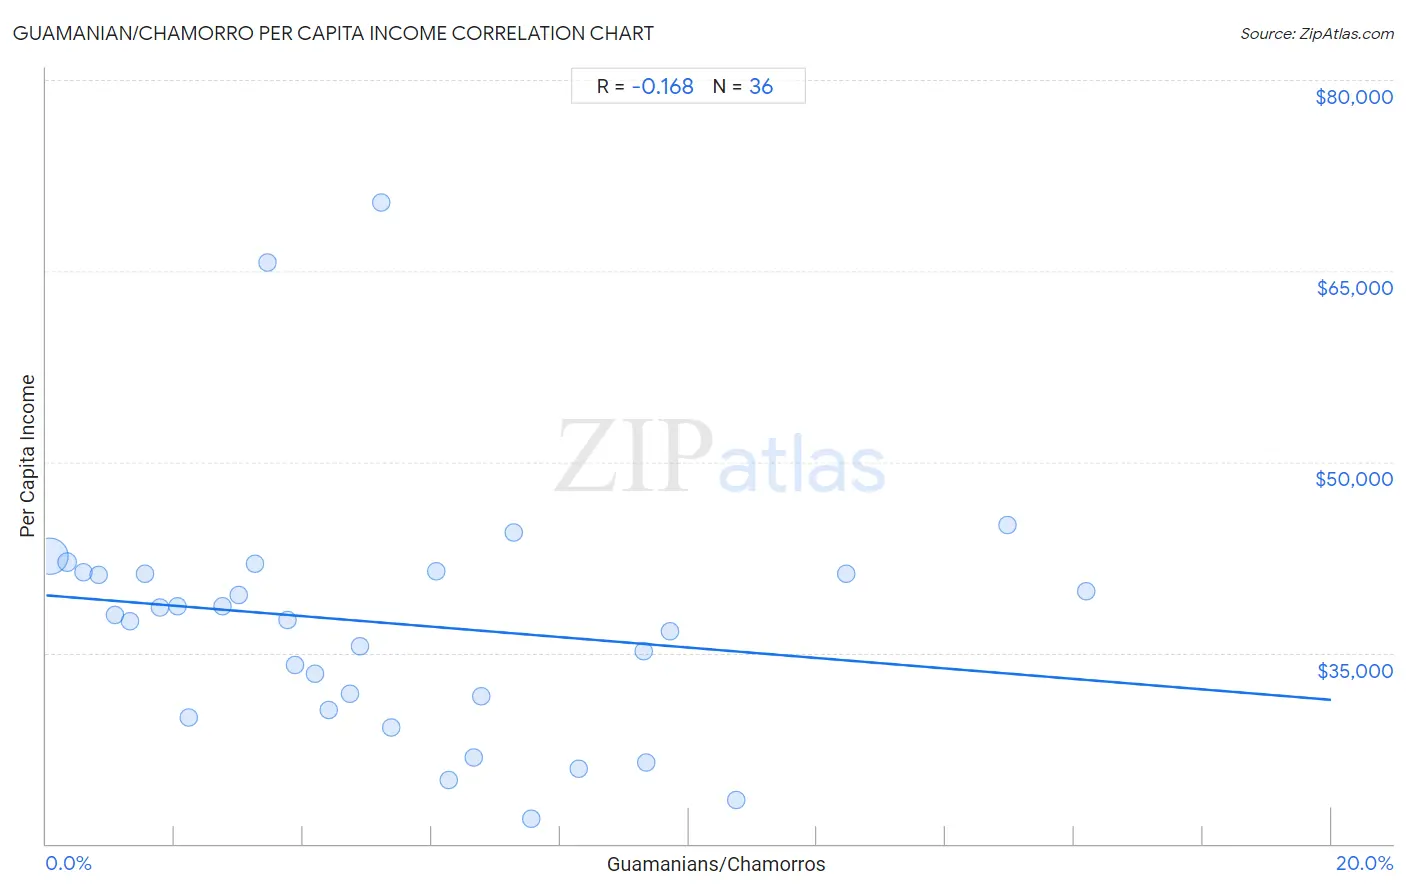
Guamanian/Chamorro Per Capita Income Correlation Chart

The statistical analysis conducted on geographies consisting of 221,916,418 people shows a poor negative correlation between the proportion of Guamanians/Chamorros and per capita income in the United States with a correlation coefficient (R) of -0.168 and weighted average of $41,678. On average, for every 1% (one percent) increase in Guamanians/Chamorros within a typical geography, there is a decrease of $410 in per capita income.
Guamanian/Chamorro Per Capita Income
It is essential to understand that the correlation between the percentage of Guamanians/Chamorros and per capita income does not imply a direct cause-and-effect relationship. It remains uncertain whether the presence of Guamanians/Chamorros influences an upward or downward trend in the level of per capita income within an area, or if Guamanians/Chamorros simply ended up residing in those areas with higher or lower levels of per capita income due to other factors.

Demographics Similar to Guamanians/Chamorros by Per Capita Income

In terms of per capita income, the demographic groups most similar to Guamanians/Chamorros are Tongan ($41,693, a difference of 0.030%), Sudanese ($41,695, a difference of 0.040%), Trinidadian and Tobagonian ($41,655, a difference of 0.060%), Immigrants from Bangladesh ($41,709, a difference of 0.070%), and Immigrants from Venezuela ($41,727, a difference of 0.12%).
DemographicsRating | RankPer Capita Income
Ecuadorians
12.9
/100
|
#210
Poor
$41,958
Immigrants from Panama
11.6
/100
|
#211
Poor
$41,853
Immigrants from Senegal
11.3
/100
|
#212
Poor
$41,830
Immigrants from Venezuela
10.2
/100
|
#213
Poor
$41,727
Immigrants from Bangladesh
10.1
/100
|
#214
Poor
$41,709
Sudanese
9.9
/100
|
#215
Tragic
$41,695
Tongans
9.9
/100
|
#216
Tragic
$41,693
Guamanians/Chamorros
9.7
/100
|
#217
Tragic
$41,678
Trinidadians and Tobagonians
9.5
/100
|
#218
Tragic
$41,655
Puget Sound Salish
8.1
/100
|
#219
Tragic
$41,495
Immigrants from Barbados
7.9
/100
|
#220
Tragic
$41,478
Immigrants from Trinidad and Tobago
7.9
/100
|
#221
Tragic
$41,476
Immigrants from Iraq
7.1
/100
|
#222
Tragic
$41,365
Immigrants from Cameroon
6.8
/100
|
#223
Tragic
$41,334
Immigrants from St. Vincent and the Grenadines
6.4
/100
|
#224
Tragic
$41,270

Guamanian/Chamorro Per Capita Income Correlation Summary

MeasurementGuamanian/Chamorro DataPer Capita Income Data
Minimum0.066%$21,937
Maximum16.2%$70,391
Range16.1%$48,454
Mean5.3%$37,325
Median4.6%$37,776
Interquartile 25% (IQ1)2.1%$31,068
Interquartile 75% (IQ3)7.4%$41,275
Interquartile Range (IQR)5.3%$10,207
Standard Deviation (Sample)4.0%$9,827
Standard Deviation (Population)4.0%$9,689

Correlation Details

Guamanian/Chamorro PercentileSample SizePer Capita Income
[
0.0%
-
0.5%
]
0.066%
190,874,624$42,547
[
0.0%
-
0.5%
]
0.33%
20,076,615$42,135
[
0.5%
-
1.0%
]
0.58%
5,638,920$41,317
[
0.5%
-
1.0%
]
0.82%
2,559,515$41,134
[
1.0%
-
1.5%
]
1.08%
1,257,939$37,936
[
1.0%
-
1.5%
]
1.29%
482,955$37,443
[
1.5%
-
2.0%
]
1.54%
411,728$41,205
[
1.5%
-
2.0%
]
1.78%
203,350$38,540
[
2.0%
-
2.5%
]
2.04%
135,642$38,670
[
2.0%
-
2.5%
]
2.22%
66,564$29,879
[
2.5%
-
3.0%
]
2.74%
25,519$38,666
[
2.5%
-
3.0%
]
2.99%
30,241$39,514
[
3.0%
-
3.5%
]
3.26%
27,988$41,968
[
3.0%
-
3.5%
]
3.45%
45,984$65,644
[
3.5%
-
4.0%
]
3.75%
10,775$37,617
[
3.5%
-
4.0%
]
3.86%
4,608$34,018
[
4.0%
-
4.5%
]
4.19%
7,782$33,372
[
4.0%
-
4.5%
]
4.41%
5,379$30,502
[
4.5%
-
5.0%
]
4.72%
25,535$31,769
[
4.5%
-
5.0%
]
4.88%
3,748$35,542
[
5.0%
-
5.5%
]
5.22%
1,974$70,391
[
5.0%
-
5.5%
]
5.36%
261$29,126
[
6.0%
-
6.5%
]
6.07%
4,758$41,392
[
6.0%
-
6.5%
]
6.27%
1,642$24,993
[
6.5%
-
7.0%
]
6.65%
857$26,765
[
6.5%
-
7.0%
]
6.77%
1,388$31,633
[
7.0%
-
7.5%
]
7.27%
1,211$44,418
[
7.5%
-
8.0%
]
7.55%
1,669$21,937
[
8.0%
-
8.5%
]
8.29%
5,262$25,893
[
9.0%
-
9.5%
]
9.30%
172$35,130
[
9.0%
-
9.5%
]
9.34%
578$26,404
[
9.5%
-
10.0%
]
9.70%
402$36,703
[
10.5%
-
11.0%
]
10.74%
121$23,476
[
12.0%
-
12.5%
]
12.46%
313$41,233
[
14.5%
-
15.0%
]
14.97%
294$45,001
[
16.0%
-
16.5%
]
16.19%
105$39,796