Guamanian/Chamorro Divorced or Separated

COMPARE

Guamanian/Chamorro
Race
Ancestry
AfghanAfricanAlaska NativeAlaskan AthabascanAlbanianAleutAlsatianAmericanApacheArabArapahoArgentineanArmenianAssyrian/Chaldean/SyriacAustralianAustrianBahamianBangladeshiBarbadianBasqueBelgianBelizeanBermudanBhutaneseBlackfeetBolivianBrazilianBritishBritish West IndianBulgarianBurmeseCajunCambodianCanadianCape VerdeanCarpatho RusynCelticCentral AmericanCentral American IndianCherokeeCheyenneChickasawChileanChineseChippewaChoctawColombianColvilleComancheCosta RicanCreeCreekCroatianCrowCubanCypriotCzechCzechoslovakianDanishDelawareDominicanDutchDutch West IndianEastern EuropeanEcuadorianEgyptianEnglishEstonianEthiopianEuropeanFijianFilipinoFinnishFrenchFrench American IndianFrench CanadianGermanGerman RussianGhanaianGreekGuamanian/ChamorroGuatemalanGuyaneseHaitianHmongHonduranHopiHoumaHungarianIcelanderIndian (Asian)IndonesianInupiatIranianIraqiIrishIroquoisIsraeliItalianJamaicanJapaneseJordanianKenyanKiowaKoreanLaotianLatvianLebaneseLiberianLithuanianLumbeeLuxembourgerMacedonianMalaysianMalteseMarshalleseMenomineeMexicanMexican American IndianMongolianMoroccanNative HawaiianNavajoNepaleseNew ZealanderNicaraguanNigerianNorthern EuropeanNorwegianOkinawanOsageOttawaPaiutePakistaniPalestinianPanamanianParaguayanPennsylvania GermanPeruvianPimaPolishPortuguesePotawatomiPuebloPuerto RicanPuget Sound SalishRomanianRussianSalvadoranSamoanScandinavianScotch-IrishScottishSeminoleSenegaleseSerbianShoshoneSierra LeoneanSiouxSlavicSlovakSloveneSomaliSouth AfricanSouth AmericanSouth American IndianSoviet UnionSpaniardSpanishSpanish AmericanSpanish American IndianSri LankanSubsaharan AfricanSudaneseSwedishSwissSyrianTaiwaneseThaiTlingit-HaidaTohono O'OdhamTonganTrinidadian and TobagonianTsimshianTurkishU.S. Virgin IslanderUgandanUkrainianUruguayanUteVenezuelanVietnameseWelshWest IndianYakamaYaquiYugoslavianYumanYup'ikZimbabwean
Immigration
NonimmigrantsImmigrantsAfghanistanAfricaAlbaniaArgentinaArmeniaAsiaAustraliaAustriaBahamasBangladeshBarbadosBelarusBelgiumBelizeBoliviaBosnia and HerzegovinaBrazilBulgariaBurma/MyanmarCabo VerdeCambodiaCameroonCanadaCaribbeanCentral AmericaChileChinaColombiaCongoCosta RicaCroatiaCubaCzechoslovakiaDenmarkDominicaDominican RepublicEastern AfricaEastern AsiaEastern EuropeEcuadorEgyptEl SalvadorEnglandEritreaEthiopiaEuropeFijiFranceGermanyGhanaGreeceGrenadaGuatemalaGuyanaHaitiHondurasHong KongHungaryIndiaIndonesiaIranIraqIrelandIsraelItalyJamaicaJapanJordanKazakhstanKenyaKoreaKuwaitLaosLatin AmericaLatviaLebanonLiberiaLithuaniaMalaysiaMexicoMicronesiaMiddle AfricaMoldovaMoroccoNepalNetherlandsNicaraguaNigeriaNorth AmericaNorth MacedoniaNorthern AfricaNorthern EuropeNorwayOceaniaPakistanPanamaPeruPhilippinesPolandPortugalRomaniaRussiaSaudi ArabiaScotlandSenegalSerbiaSierra LeoneSingaporeSomaliaSouth AfricaSouth AmericaSouth Central AsiaSouth Eastern AsiaSouthern EuropeSpainSri LankaSt. Vincent and the GrenadinesSudanSwedenSwitzerlandSyriaTaiwanThailandTrinidad and TobagoTurkeyUgandaUkraineUruguayUzbekistanVenezuelaVietnamWest IndiesWestern AfricaWestern AsiaWestern EuropeYemenZaireZimbabweAzores
Select to Compare
Race
Ancestry
AfghanAfricanAlaska NativeAlaskan AthabascanAlbanianAleutAlsatianAmericanApacheArabArapahoArgentineanArmenianAssyrian/Chaldean/SyriacAustralianAustrianBahamianBangladeshiBarbadianBasqueBelgianBelizeanBermudanBhutaneseBlackfeetBolivianBrazilianBritishBritish West IndianBulgarianBurmeseCajunCambodianCanadianCape VerdeanCarpatho RusynCelticCentral AmericanCentral American IndianCherokeeCheyenneChickasawChileanChineseChippewaChoctawColombianColvilleComancheCosta RicanCreeCreekCroatianCrowCubanCypriotCzechCzechoslovakianDanishDelawareDominicanDutchDutch West IndianEastern EuropeanEcuadorianEgyptianEnglishEstonianEthiopianEuropeanFijianFilipinoFinnishFrenchFrench American IndianFrench CanadianGermanGerman RussianGhanaianGreekGuatemalanGuyaneseHaitianHmongHonduranHopiHoumaHungarianIcelanderIndian (Asian)IndonesianInupiatIranianIraqiIrishIroquoisIsraeliItalianJamaicanJapaneseJordanianKenyanKiowaKoreanLaotianLatvianLebaneseLiberianLithuanianLumbeeLuxembourgerMacedonianMalaysianMalteseMarshalleseMenomineeMexicanMexican American IndianMongolianMoroccanNative HawaiianNavajoNepaleseNew ZealanderNicaraguanNigerianNorthern EuropeanNorwegianOkinawanOsageOttawaPaiutePakistaniPalestinianPanamanianParaguayanPennsylvania GermanPeruvianPimaPolishPortuguesePotawatomiPuebloPuerto RicanPuget Sound SalishRomanianRussianSalvadoranSamoanScandinavianScotch-IrishScottishSeminoleSenegaleseSerbianShoshoneSierra LeoneanSiouxSlavicSlovakSloveneSomaliSouth AfricanSouth AmericanSouth American IndianSoviet UnionSpaniardSpanishSpanish AmericanSpanish American IndianSri LankanSubsaharan AfricanSudaneseSwedishSwissSyrianTaiwaneseThaiTlingit-HaidaTohono O'OdhamTonganTrinidadian and TobagonianTsimshianTurkishU.S. Virgin IslanderUgandanUkrainianUruguayanUteVenezuelanVietnameseWelshWest IndianYakamaYaquiYugoslavianYumanYup'ikZimbabwean
Immigration
NonimmigrantsImmigrantsAfghanistanAfricaAlbaniaArgentinaArmeniaAsiaAustraliaAustriaBahamasBangladeshBarbadosBelarusBelgiumBelizeBoliviaBosnia and HerzegovinaBrazilBulgariaBurma/MyanmarCabo VerdeCambodiaCameroonCanadaCaribbeanCentral AmericaChileChinaColombiaCongoCosta RicaCroatiaCubaCzechoslovakiaDenmarkDominicaDominican RepublicEastern AfricaEastern AsiaEastern EuropeEcuadorEgyptEl SalvadorEnglandEritreaEthiopiaEuropeFijiFranceGermanyGhanaGreeceGrenadaGuatemalaGuyanaHaitiHondurasHong KongHungaryIndiaIndonesiaIranIraqIrelandIsraelItalyJamaicaJapanJordanKazakhstanKenyaKoreaKuwaitLaosLatin AmericaLatviaLebanonLiberiaLithuaniaMalaysiaMexicoMicronesiaMiddle AfricaMoldovaMoroccoNepalNetherlandsNicaraguaNigeriaNorth AmericaNorth MacedoniaNorthern AfricaNorthern EuropeNorwayOceaniaPakistanPanamaPeruPhilippinesPolandPortugalRomaniaRussiaSaudi ArabiaScotlandSenegalSerbiaSierra LeoneSingaporeSomaliaSouth AfricaSouth AmericaSouth Central AsiaSouth Eastern AsiaSouthern EuropeSpainSri LankaSt. Vincent and the GrenadinesSudanSwedenSwitzerlandSyriaTaiwanThailandTrinidad and TobagoTurkeyUgandaUkraineUruguayUzbekistanVenezuelaVietnamWest IndiesWestern AfricaWestern AsiaWestern EuropeYemenZaireZimbabweAzores
Divorced or Separated
Income
Poverty
Unemployment
Labor Participation
Family Structure
Vehicle Availability
Education Level
Disability

Guamanian/Chamorro Divorced or Separated
Poor

12.3%
DIVORCED OR SEPARATED
11.3/ 100
METRIC RATING
221st/ 347
METRIC RANK

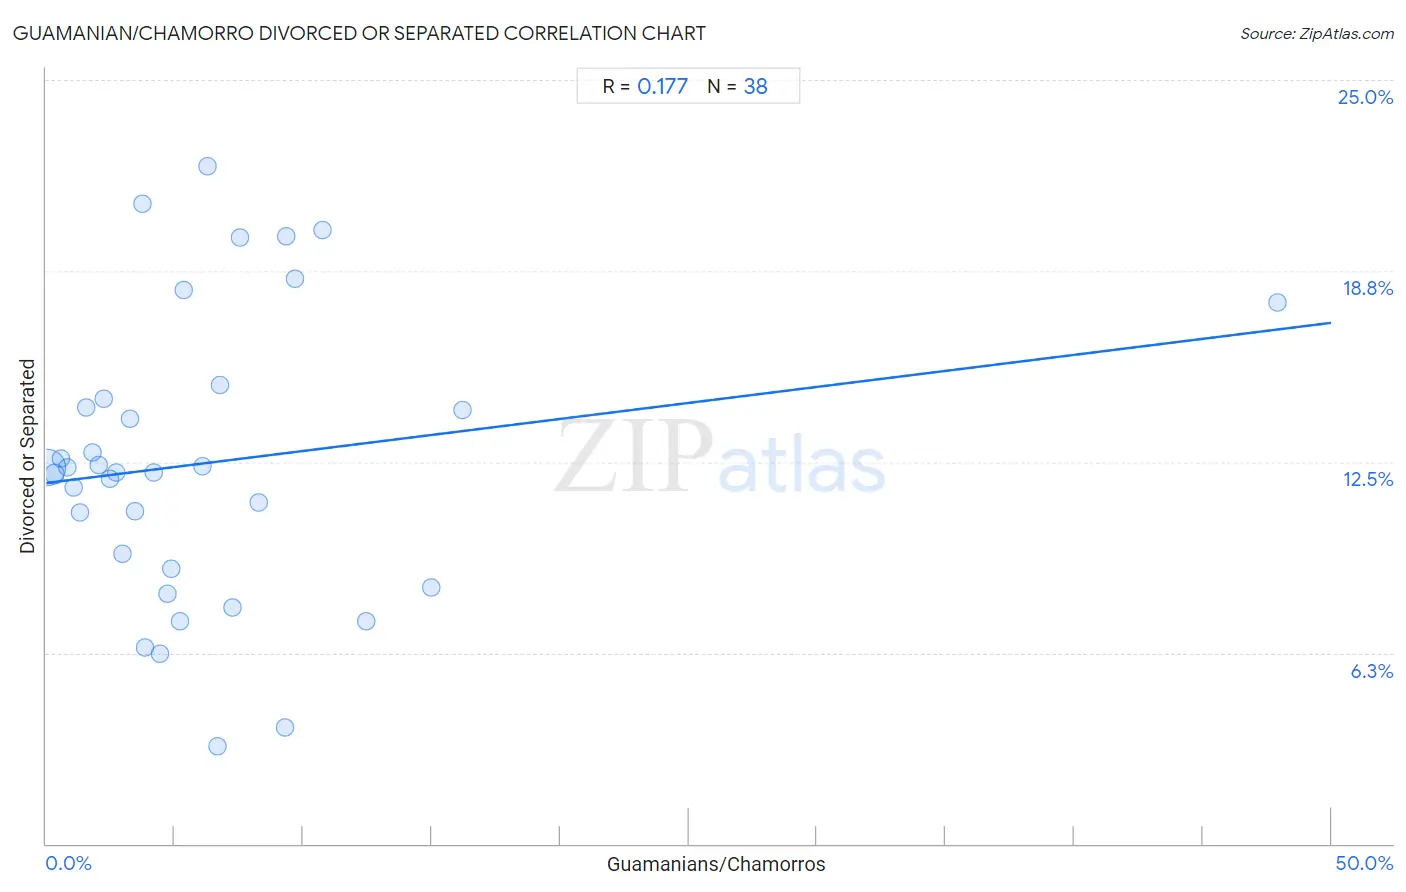
Guamanian/Chamorro Divorced or Separated Correlation Chart

The statistical analysis conducted on geographies consisting of 221,943,719 people shows a poor positive correlation between the proportion of Guamanians/Chamorros and percentage of population currently divorced or separated in the United States with a correlation coefficient (R) of 0.177 and weighted average of 12.3%. On average, for every 1% (one percent) increase in Guamanians/Chamorros within a typical geography, there is an increase of 0.10% in percentage of population currently divorced or separated.
Guamanian/Chamorro Divorced or Separated
It is essential to understand that the correlation between the percentage of Guamanians/Chamorros and percentage of population currently divorced or separated does not imply a direct cause-and-effect relationship. It remains uncertain whether the presence of Guamanians/Chamorros influences an upward or downward trend in the level of percentage of population currently divorced or separated within an area, or if Guamanians/Chamorros simply ended up residing in those areas with higher or lower levels of percentage of population currently divorced or separated due to other factors.

Demographics Similar to Guamanians/Chamorros by Divorced or Separated

In terms of divorced or separated, the demographic groups most similar to Guamanians/Chamorros are Czechoslovakian (12.3%, a difference of 0.030%), British (12.3%, a difference of 0.030%), Bangladeshi (12.3%, a difference of 0.070%), Scandinavian (12.3%, a difference of 0.080%), and Slovene (12.3%, a difference of 0.15%).
DemographicsRating | RankDivorced or Separated
Immigrants from Argentina
15.5
/100
|
#214
Poor
12.2%
Europeans
15.4
/100
|
#215
Poor
12.2%
Immigrants from South America
15.4
/100
|
#216
Poor
12.2%
Northern Europeans
14.7
/100
|
#217
Poor
12.2%
Slovenes
13.2
/100
|
#218
Poor
12.3%
Czechoslovakians
11.7
/100
|
#219
Poor
12.3%
British
11.6
/100
|
#220
Poor
12.3%
Guamanians/Chamorros
11.3
/100
|
#221
Poor
12.3%
Bangladeshis
10.5
/100
|
#222
Poor
12.3%
Scandinavians
10.4
/100
|
#223
Poor
12.3%
Immigrants from the Azores
9.7
/100
|
#224
Tragic
12.3%
Belgians
9.7
/100
|
#225
Tragic
12.3%
Immigrants from Western Africa
9.3
/100
|
#226
Tragic
12.3%
Hmong
8.8
/100
|
#227
Tragic
12.3%
Immigrants from Cameroon
8.3
/100
|
#228
Tragic
12.3%

Guamanian/Chamorro Divorced or Separated Correlation Summary

MeasurementGuamanian/Chamorro DataDivorced or Separated Data
Minimum0.066%3.2%
Maximum47.9%22.2%
Range47.8%19.0%
Mean6.4%12.5%
Median4.6%12.2%
Interquartile 25% (IQ1)2.2%9.0%
Interquartile 75% (IQ3)7.5%14.6%
Interquartile Range (IQR)5.3%5.6%
Standard Deviation (Sample)8.0%4.7%
Standard Deviation (Population)7.9%4.7%

Correlation Details

Guamanian/Chamorro PercentileSample SizeDivorced or Separated
[
0.0%
-
0.5%
]
0.066%
190,864,30012.3%
[
0.0%
-
0.5%
]
0.33%
20,072,69912.1%
[
0.5%
-
1.0%
]
0.58%
5,637,85312.6%
[
0.5%
-
1.0%
]
0.82%
2,559,51512.3%
[
1.0%
-
1.5%
]
1.08%
1,254,55211.7%
[
1.0%
-
1.5%
]
1.29%
482,95510.8%
[
1.5%
-
2.0%
]
1.54%
409,37514.3%
[
1.5%
-
2.0%
]
1.78%
203,35012.8%
[
2.0%
-
2.5%
]
2.04%
135,64212.4%
[
2.0%
-
2.5%
]
2.22%
66,56414.6%
[
2.0%
-
2.5%
]
2.49%
49,70312.0%
[
2.5%
-
3.0%
]
2.74%
25,51912.2%
[
2.5%
-
3.0%
]
2.99%
29,8629.5%
[
3.0%
-
3.5%
]
3.26%
27,98813.9%
[
3.0%
-
3.5%
]
3.45%
45,98410.9%
[
3.5%
-
4.0%
]
3.75%
9,68021.0%
[
3.5%
-
4.0%
]
3.86%
4,6086.4%
[
4.0%
-
4.5%
]
4.19%
7,78212.2%
[
4.0%
-
4.5%
]
4.41%
5,3796.2%
[
4.5%
-
5.0%
]
4.72%
25,5358.2%
[
4.5%
-
5.0%
]
4.88%
3,7489.0%
[
5.0%
-
5.5%
]
5.22%
1,9747.3%
[
5.0%
-
5.5%
]
5.36%
26118.1%
[
6.0%
-
6.5%
]
6.07%
4,75812.3%
[
6.0%
-
6.5%
]
6.27%
1,64222.2%
[
6.5%
-
7.0%
]
6.65%
8573.2%
[
6.5%
-
7.0%
]
6.77%
1,38815.0%
[
7.0%
-
7.5%
]
7.27%
1,2117.8%
[
7.5%
-
8.0%
]
7.55%
1,66919.9%
[
8.0%
-
8.5%
]
8.29%
5,26211.2%
[
9.0%
-
9.5%
]
9.30%
1723.8%
[
9.0%
-
9.5%
]
9.34%
57819.9%
[
9.5%
-
10.0%
]
9.70%
40218.5%
[
10.5%
-
11.0%
]
10.74%
12120.1%
[
12.0%
-
12.5%
]
12.46%
3137.3%
[
14.5%
-
15.0%
]
14.97%
2948.4%
[
16.0%
-
16.5%
]
16.19%
10514.2%
[
47.5%
-
48.0%
]
47.90%
11917.7%