Guamanian/Chamorro Cognitive Disability
COMPARE
Guamanian/Chamorro
Select to Compare
Cognitive Disability
Guamanian/Chamorro Cognitive Disability
17.9%
COGNITIVE DISABILITY
0.5/ 100
METRIC RATING
261st/ 347
METRIC RANK
Guamanian/Chamorro Cognitive Disability Correlation Chart
The statistical analysis conducted on geographies consisting of 221,888,944 people shows a strong positive correlation between the proportion of Guamanians/Chamorros and percentage of population with cognitive disability in the United States with a correlation coefficient (R) of 0.764 and weighted average of 17.9%. On average, for every 1% (one percent) increase in Guamanians/Chamorros within a typical geography, there is an increase of 1.4% in percentage of population with cognitive disability.
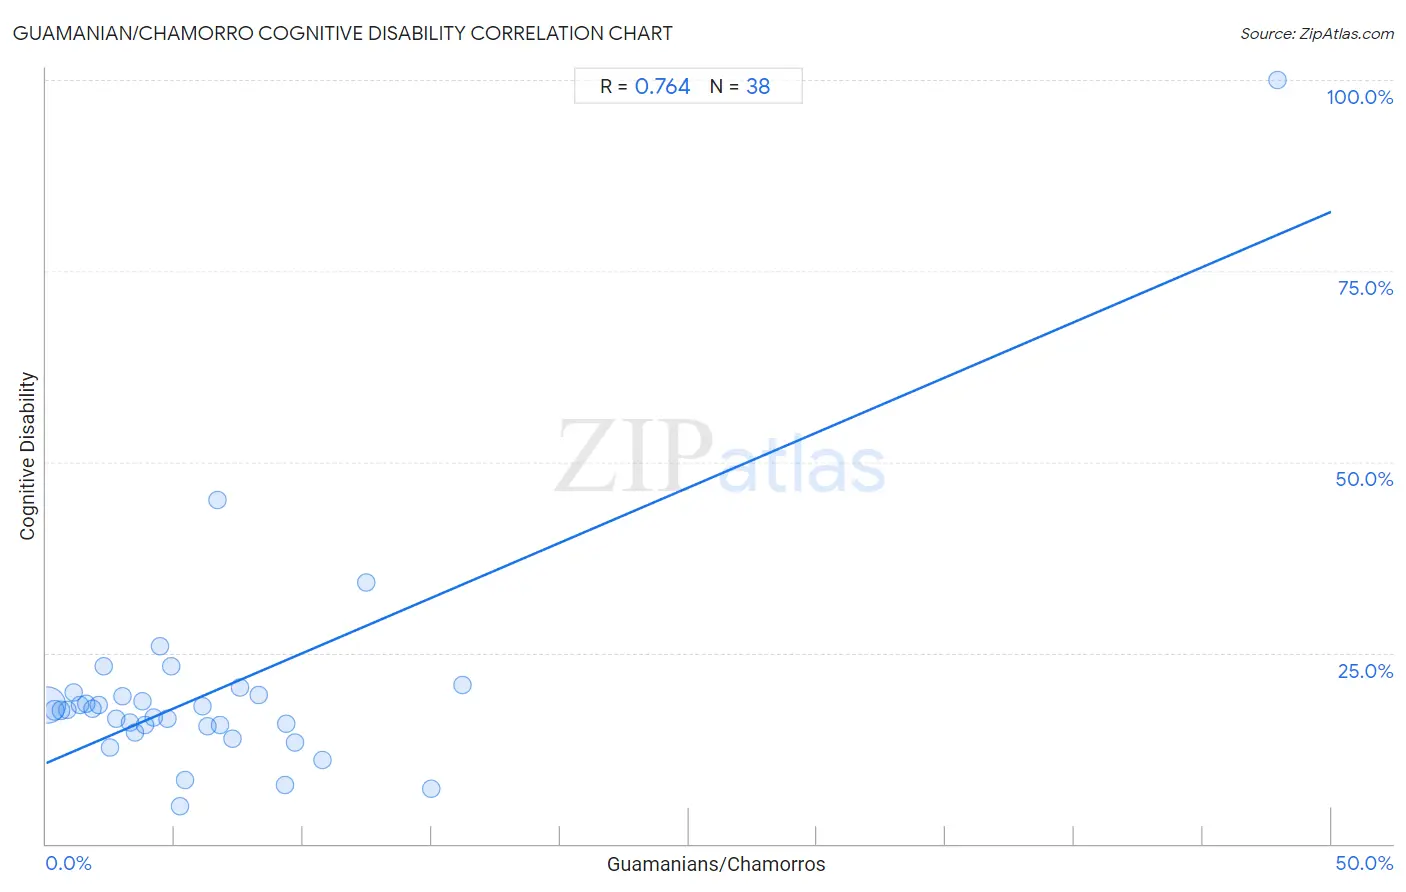
It is essential to understand that the correlation between the percentage of Guamanians/Chamorros and percentage of population with cognitive disability does not imply a direct cause-and-effect relationship. It remains uncertain whether the presence of Guamanians/Chamorros influences an upward or downward trend in the level of percentage of population with cognitive disability within an area, or if Guamanians/Chamorros simply ended up residing in those areas with higher or lower levels of percentage of population with cognitive disability due to other factors.
Demographics Similar to Guamanians/Chamorros by Cognitive Disability
In terms of cognitive disability, the demographic groups most similar to Guamanians/Chamorros are Sierra Leonean (17.9%, a difference of 0.030%), Immigrants from Belize (17.9%, a difference of 0.050%), Ethiopian (17.9%, a difference of 0.060%), Immigrants from Barbados (17.9%, a difference of 0.070%), and Menominee (18.0%, a difference of 0.13%).
| Demographics | Rating | Rank | Cognitive Disability |
| Hispanics or Latinos | 0.6 /100 | #254 | Tragic 17.9% |
| Immigrants from the Azores | 0.6 /100 | #255 | Tragic 17.9% |
| Bahamians | 0.6 /100 | #256 | Tragic 17.9% |
| Mexican American Indians | 0.6 /100 | #257 | Tragic 17.9% |
| Immigrants from Armenia | 0.6 /100 | #258 | Tragic 17.9% |
| Ethiopians | 0.5 /100 | #259 | Tragic 17.9% |
| Immigrants from Belize | 0.5 /100 | #260 | Tragic 17.9% |
| Guamanians/Chamorros | 0.5 /100 | #261 | Tragic 17.9% |
| Sierra Leoneans | 0.4 /100 | #262 | Tragic 17.9% |
| Immigrants from Barbados | 0.4 /100 | #263 | Tragic 17.9% |
| Menominee | 0.4 /100 | #264 | Tragic 18.0% |
| Spanish Americans | 0.4 /100 | #265 | Tragic 18.0% |
| Belizeans | 0.4 /100 | #266 | Tragic 18.0% |
| Nepalese | 0.3 /100 | #267 | Tragic 18.0% |
| Cherokee | 0.3 /100 | #268 | Tragic 18.0% |
Guamanian/Chamorro Cognitive Disability Correlation Summary
| Measurement | Guamanian/Chamorro Data | Cognitive Disability Data |
| Minimum | 0.066% | 5.0% |
| Maximum | 47.9% | 100.0% |
| Range | 47.8% | 95.0% |
| Mean | 6.4% | 19.8% |
| Median | 4.6% | 17.5% |
| Interquartile 25% (IQ1) | 2.2% | 15.4% |
| Interquartile 75% (IQ3) | 7.5% | 19.5% |
| Interquartile Range (IQR) | 5.3% | 4.0% |
| Standard Deviation (Sample) | 8.0% | 15.1% |
| Standard Deviation (Population) | 7.9% | 14.9% |
Correlation Details
| Guamanian/Chamorro Percentile | Sample Size | Cognitive Disability |
[ 0.0% - 0.5% ] 0.066% | 190,846,214 | 18.2% |
[ 0.0% - 0.5% ] 0.33% | 20,056,041 | 17.4% |
[ 0.5% - 1.0% ] 0.58% | 5,628,192 | 17.4% |
[ 0.5% - 1.0% ] 0.82% | 2,549,885 | 17.6% |
[ 1.0% - 1.5% ] 1.08% | 1,257,582 | 19.8% |
[ 1.0% - 1.5% ] 1.29% | 477,459 | 18.1% |
[ 1.5% - 2.0% ] 1.54% | 411,728 | 18.3% |
[ 1.5% - 2.0% ] 1.78% | 203,350 | 17.7% |
[ 2.0% - 2.5% ] 2.04% | 135,549 | 18.1% |
[ 2.0% - 2.5% ] 2.22% | 66,564 | 23.3% |
[ 2.0% - 2.5% ] 2.49% | 49,703 | 12.6% |
[ 2.5% - 3.0% ] 2.74% | 24,712 | 16.4% |
[ 2.5% - 3.0% ] 2.99% | 30,241 | 19.3% |
[ 3.0% - 3.5% ] 3.26% | 27,988 | 15.9% |
[ 3.0% - 3.5% ] 3.45% | 45,984 | 14.6% |
[ 3.5% - 4.0% ] 3.75% | 9,680 | 18.7% |
[ 3.5% - 4.0% ] 3.86% | 4,608 | 15.6% |
[ 4.0% - 4.5% ] 4.19% | 7,782 | 16.5% |
[ 4.0% - 4.5% ] 4.41% | 5,379 | 25.9% |
[ 4.5% - 5.0% ] 4.72% | 25,535 | 16.4% |
[ 4.5% - 5.0% ] 4.88% | 3,748 | 23.2% |
[ 5.0% - 5.5% ] 5.22% | 1,974 | 5.0% |
[ 5.0% - 5.5% ] 5.38% | 186 | 8.4% |
[ 6.0% - 6.5% ] 6.07% | 4,758 | 18.0% |
[ 6.0% - 6.5% ] 6.27% | 1,611 | 15.4% |
[ 6.5% - 7.0% ] 6.65% | 857 | 45.0% |
[ 6.5% - 7.0% ] 6.77% | 1,388 | 15.5% |
[ 7.0% - 7.5% ] 7.27% | 1,211 | 13.8% |
[ 7.5% - 8.0% ] 7.55% | 1,669 | 20.5% |
[ 8.0% - 8.5% ] 8.29% | 5,262 | 19.5% |
[ 9.0% - 9.5% ] 9.30% | 172 | 7.7% |
[ 9.0% - 9.5% ] 9.34% | 578 | 15.7% |
[ 9.5% - 10.0% ] 9.70% | 402 | 13.2% |
[ 10.5% - 11.0% ] 10.74% | 121 | 10.9% |
[ 12.0% - 12.5% ] 12.46% | 313 | 34.2% |
[ 14.5% - 15.0% ] 14.97% | 294 | 7.2% |
[ 16.0% - 16.5% ] 16.19% | 105 | 20.8% |
[ 47.5% - 48.0% ] 47.90% | 119 | 100.0% |