Guamanian/Chamorro Median Family Income

COMPARE

Guamanian/Chamorro
Race
Ancestry
AfghanAfricanAlaska NativeAlaskan AthabascanAlbanianAleutAlsatianAmericanApacheArabArapahoArgentineanArmenianAssyrian/Chaldean/SyriacAustralianAustrianBahamianBangladeshiBarbadianBasqueBelgianBelizeanBermudanBhutaneseBlackfeetBolivianBrazilianBritishBritish West IndianBulgarianBurmeseCajunCambodianCanadianCape VerdeanCarpatho RusynCelticCentral AmericanCentral American IndianCherokeeCheyenneChickasawChileanChineseChippewaChoctawColombianColvilleComancheCosta RicanCreeCreekCroatianCrowCubanCypriotCzechCzechoslovakianDanishDelawareDominicanDutchDutch West IndianEastern EuropeanEcuadorianEgyptianEnglishEstonianEthiopianEuropeanFijianFilipinoFinnishFrenchFrench American IndianFrench CanadianGermanGerman RussianGhanaianGreekGuamanian/ChamorroGuatemalanGuyaneseHaitianHmongHonduranHopiHoumaHungarianIcelanderIndian (Asian)IndonesianInupiatIranianIraqiIrishIroquoisIsraeliItalianJamaicanJapaneseJordanianKenyanKiowaKoreanLaotianLatvianLebaneseLiberianLithuanianLumbeeLuxembourgerMacedonianMalaysianMalteseMarshalleseMenomineeMexicanMexican American IndianMongolianMoroccanNative HawaiianNavajoNepaleseNew ZealanderNicaraguanNigerianNorthern EuropeanNorwegianOkinawanOsageOttawaPaiutePakistaniPalestinianPanamanianParaguayanPennsylvania GermanPeruvianPimaPolishPortuguesePotawatomiPuebloPuerto RicanPuget Sound SalishRomanianRussianSalvadoranSamoanScandinavianScotch-IrishScottishSeminoleSenegaleseSerbianShoshoneSierra LeoneanSiouxSlavicSlovakSloveneSomaliSouth AfricanSouth AmericanSouth American IndianSoviet UnionSpaniardSpanishSpanish AmericanSpanish American IndianSri LankanSubsaharan AfricanSudaneseSwedishSwissSyrianTaiwaneseThaiTlingit-HaidaTohono O'OdhamTonganTrinidadian and TobagonianTsimshianTurkishU.S. Virgin IslanderUgandanUkrainianUruguayanUteVenezuelanVietnameseWelshWest IndianYakamaYaquiYugoslavianYumanYup'ikZimbabwean
Immigration
NonimmigrantsImmigrantsAfghanistanAfricaAlbaniaArgentinaArmeniaAsiaAustraliaAustriaBahamasBangladeshBarbadosBelarusBelgiumBelizeBoliviaBosnia and HerzegovinaBrazilBulgariaBurma/MyanmarCabo VerdeCambodiaCameroonCanadaCaribbeanCentral AmericaChileChinaColombiaCongoCosta RicaCroatiaCubaCzechoslovakiaDenmarkDominicaDominican RepublicEastern AfricaEastern AsiaEastern EuropeEcuadorEgyptEl SalvadorEnglandEritreaEthiopiaEuropeFijiFranceGermanyGhanaGreeceGrenadaGuatemalaGuyanaHaitiHondurasHong KongHungaryIndiaIndonesiaIranIraqIrelandIsraelItalyJamaicaJapanJordanKazakhstanKenyaKoreaKuwaitLaosLatin AmericaLatviaLebanonLiberiaLithuaniaMalaysiaMexicoMicronesiaMiddle AfricaMoldovaMoroccoNepalNetherlandsNicaraguaNigeriaNorth AmericaNorth MacedoniaNorthern AfricaNorthern EuropeNorwayOceaniaPakistanPanamaPeruPhilippinesPolandPortugalRomaniaRussiaSaudi ArabiaScotlandSenegalSerbiaSierra LeoneSingaporeSomaliaSouth AfricaSouth AmericaSouth Central AsiaSouth Eastern AsiaSouthern EuropeSpainSri LankaSt. Vincent and the GrenadinesSudanSwedenSwitzerlandSyriaTaiwanThailandTrinidad and TobagoTurkeyUgandaUkraineUruguayUzbekistanVenezuelaVietnamWest IndiesWestern AfricaWestern AsiaWestern EuropeYemenZaireZimbabweAzores
Select to Compare
Race
Ancestry
AfghanAfricanAlaska NativeAlaskan AthabascanAlbanianAleutAlsatianAmericanApacheArabArapahoArgentineanArmenianAssyrian/Chaldean/SyriacAustralianAustrianBahamianBangladeshiBarbadianBasqueBelgianBelizeanBermudanBhutaneseBlackfeetBolivianBrazilianBritishBritish West IndianBulgarianBurmeseCajunCambodianCanadianCape VerdeanCarpatho RusynCelticCentral AmericanCentral American IndianCherokeeCheyenneChickasawChileanChineseChippewaChoctawColombianColvilleComancheCosta RicanCreeCreekCroatianCrowCubanCypriotCzechCzechoslovakianDanishDelawareDominicanDutchDutch West IndianEastern EuropeanEcuadorianEgyptianEnglishEstonianEthiopianEuropeanFijianFilipinoFinnishFrenchFrench American IndianFrench CanadianGermanGerman RussianGhanaianGreekGuatemalanGuyaneseHaitianHmongHonduranHopiHoumaHungarianIcelanderIndian (Asian)IndonesianInupiatIranianIraqiIrishIroquoisIsraeliItalianJamaicanJapaneseJordanianKenyanKiowaKoreanLaotianLatvianLebaneseLiberianLithuanianLumbeeLuxembourgerMacedonianMalaysianMalteseMarshalleseMenomineeMexicanMexican American IndianMongolianMoroccanNative HawaiianNavajoNepaleseNew ZealanderNicaraguanNigerianNorthern EuropeanNorwegianOkinawanOsageOttawaPaiutePakistaniPalestinianPanamanianParaguayanPennsylvania GermanPeruvianPimaPolishPortuguesePotawatomiPuebloPuerto RicanPuget Sound SalishRomanianRussianSalvadoranSamoanScandinavianScotch-IrishScottishSeminoleSenegaleseSerbianShoshoneSierra LeoneanSiouxSlavicSlovakSloveneSomaliSouth AfricanSouth AmericanSouth American IndianSoviet UnionSpaniardSpanishSpanish AmericanSpanish American IndianSri LankanSubsaharan AfricanSudaneseSwedishSwissSyrianTaiwaneseThaiTlingit-HaidaTohono O'OdhamTonganTrinidadian and TobagonianTsimshianTurkishU.S. Virgin IslanderUgandanUkrainianUruguayanUteVenezuelanVietnameseWelshWest IndianYakamaYaquiYugoslavianYumanYup'ikZimbabwean
Immigration
NonimmigrantsImmigrantsAfghanistanAfricaAlbaniaArgentinaArmeniaAsiaAustraliaAustriaBahamasBangladeshBarbadosBelarusBelgiumBelizeBoliviaBosnia and HerzegovinaBrazilBulgariaBurma/MyanmarCabo VerdeCambodiaCameroonCanadaCaribbeanCentral AmericaChileChinaColombiaCongoCosta RicaCroatiaCubaCzechoslovakiaDenmarkDominicaDominican RepublicEastern AfricaEastern AsiaEastern EuropeEcuadorEgyptEl SalvadorEnglandEritreaEthiopiaEuropeFijiFranceGermanyGhanaGreeceGrenadaGuatemalaGuyanaHaitiHondurasHong KongHungaryIndiaIndonesiaIranIraqIrelandIsraelItalyJamaicaJapanJordanKazakhstanKenyaKoreaKuwaitLaosLatin AmericaLatviaLebanonLiberiaLithuaniaMalaysiaMexicoMicronesiaMiddle AfricaMoldovaMoroccoNepalNetherlandsNicaraguaNigeriaNorth AmericaNorth MacedoniaNorthern AfricaNorthern EuropeNorwayOceaniaPakistanPanamaPeruPhilippinesPolandPortugalRomaniaRussiaSaudi ArabiaScotlandSenegalSerbiaSierra LeoneSingaporeSomaliaSouth AfricaSouth AmericaSouth Central AsiaSouth Eastern AsiaSouthern EuropeSpainSri LankaSt. Vincent and the GrenadinesSudanSwedenSwitzerlandSyriaTaiwanThailandTrinidad and TobagoTurkeyUgandaUkraineUruguayUzbekistanVenezuelaVietnamWest IndiesWestern AfricaWestern AsiaWestern EuropeYemenZaireZimbabweAzores
Median Family Income
Income
Poverty
Unemployment
Labor Participation
Family Structure
Vehicle Availability
Education Level
Disability

Guamanian/Chamorro Median Family Income
Fair

$101,061
FAMILY INCOME
30.5/ 100
METRIC RATING
188th/ 347
METRIC RANK

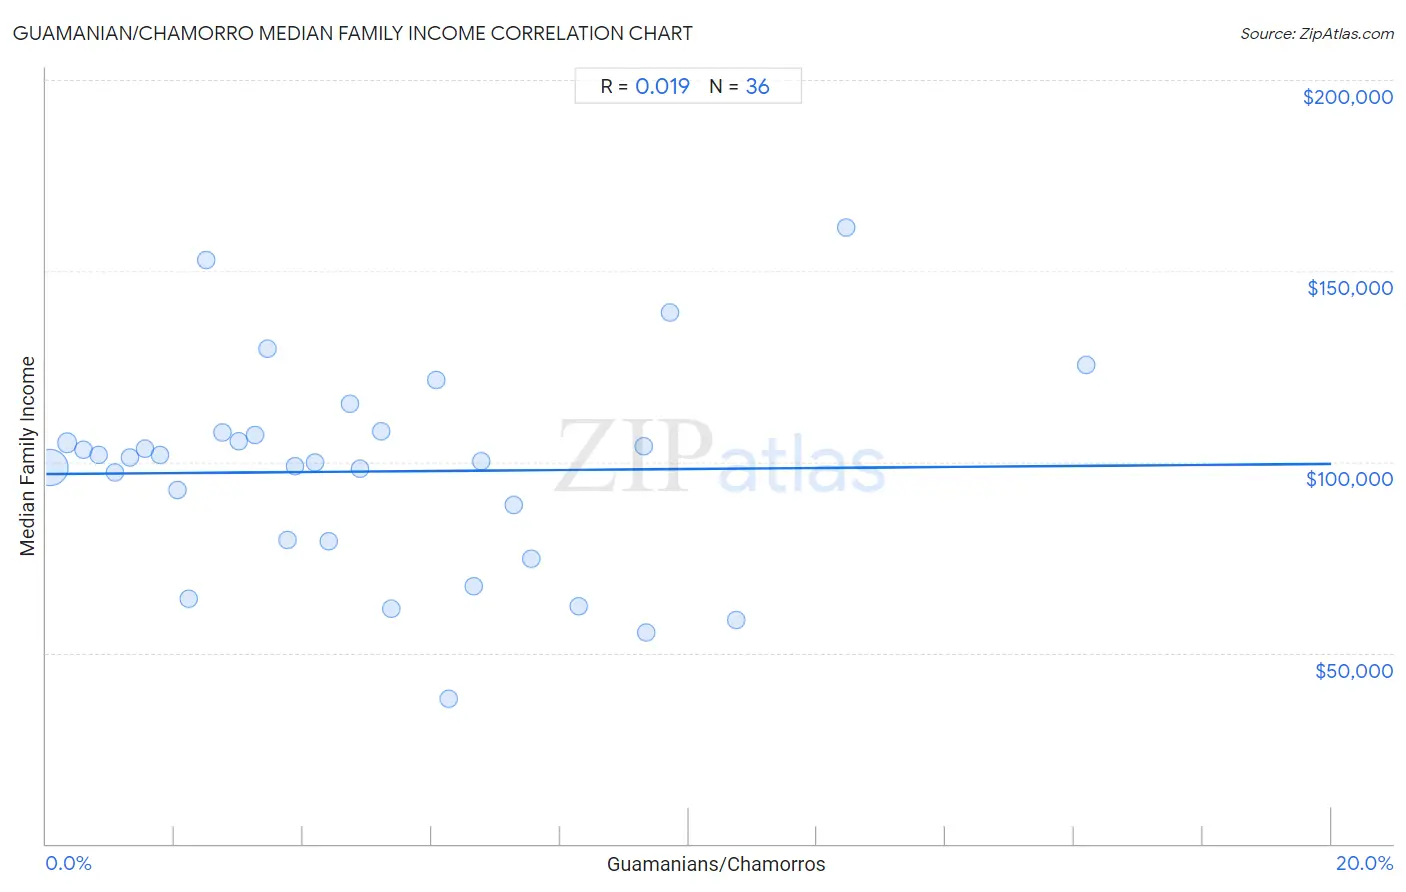
Guamanian/Chamorro Median Family Income Correlation Chart

The statistical analysis conducted on geographies consisting of 221,859,912 people shows no correlation between the proportion of Guamanians/Chamorros and median family income in the United States with a correlation coefficient (R) of 0.019 and weighted average of $101,061. On average, for every 1% (one percent) increase in Guamanians/Chamorros within a typical geography, there is an increase of $133 in median family income.
Guamanian/Chamorro Median Family Income
It is essential to understand that the correlation between the percentage of Guamanians/Chamorros and median family income does not imply a direct cause-and-effect relationship. It remains uncertain whether the presence of Guamanians/Chamorros influences an upward or downward trend in the level of median family income within an area, or if Guamanians/Chamorros simply ended up residing in those areas with higher or lower levels of median family income due to other factors.

Demographics Similar to Guamanians/Chamorros by Median Family Income

In terms of median family income, the demographic groups most similar to Guamanians/Chamorros are Tlingit-Haida ($101,092, a difference of 0.030%), Celtic ($101,139, a difference of 0.080%), Immigrants from Portugal ($100,984, a difference of 0.080%), Immigrants ($100,962, a difference of 0.10%), and Dutch ($101,192, a difference of 0.13%).
DemographicsRating | RankMedian Family Income
Spaniards
36.8
/100
|
#181
Fair
$101,617
Tsimshian
35.9
/100
|
#182
Fair
$101,543
Kenyans
34.5
/100
|
#183
Fair
$101,417
Immigrants from Costa Rica
33.7
/100
|
#184
Fair
$101,354
Dutch
31.9
/100
|
#185
Fair
$101,192
Celtics
31.3
/100
|
#186
Fair
$101,139
Tlingit-Haida
30.8
/100
|
#187
Fair
$101,092
Guamanians/Chamorros
30.5
/100
|
#188
Fair
$101,061
Immigrants from Portugal
29.6
/100
|
#189
Fair
$100,984
Immigrants
29.4
/100
|
#190
Fair
$100,962
Colombians
27.2
/100
|
#191
Fair
$100,750
Immigrants from Kenya
26.5
/100
|
#192
Fair
$100,679
Iraqis
26.3
/100
|
#193
Fair
$100,658
Uruguayans
26.3
/100
|
#194
Fair
$100,656
Immigrants from South America
23.9
/100
|
#195
Fair
$100,414

Guamanian/Chamorro Median Family Income Correlation Summary

MeasurementGuamanian/Chamorro DataMedian Family Income Data
Minimum0.066%$37,991
Maximum16.2%$161,250
Range16.1%$123,259
Mean5.0%$97,460
Median4.3%$100,672
Interquartile 25% (IQ1)2.1%$79,398
Interquartile 75% (IQ3)7.0%$107,355
Interquartile Range (IQR)4.9%$27,957
Standard Deviation (Sample)3.7%$26,595
Standard Deviation (Population)3.7%$26,223

Correlation Details

Guamanian/Chamorro PercentileSample SizeMedian Family Income
[
0.0%
-
0.5%
]
0.066%
190,833,511$98,376
[
0.0%
-
0.5%
]
0.33%
20,049,443$105,052
[
0.5%
-
1.0%
]
0.58%
5,623,894$103,090
[
0.5%
-
1.0%
]
0.82%
2,548,877$101,807
[
1.0%
-
1.5%
]
1.08%
1,256,191$97,213
[
1.0%
-
1.5%
]
1.29%
477,459$101,159
[
1.5%
-
2.0%
]
1.54%
409,001$103,459
[
1.5%
-
2.0%
]
1.78%
203,350$101,927
[
2.0%
-
2.5%
]
2.04%
135,549$92,716
[
2.0%
-
2.5%
]
2.22%
66,564$64,073
[
2.0%
-
2.5%
]
2.49%
49,703$152,760
[
2.5%
-
3.0%
]
2.74%
24,712$107,748
[
2.5%
-
3.0%
]
2.99%
30,241$105,512
[
3.0%
-
3.5%
]
3.26%
27,988$106,961
[
3.0%
-
3.5%
]
3.45%
45,984$129,531
[
3.5%
-
4.0%
]
3.75%
9,680$79,493
[
3.5%
-
4.0%
]
3.86%
4,608$98,781
[
4.0%
-
4.5%
]
4.19%
7,782$99,805
[
4.0%
-
4.5%
]
4.41%
5,379$79,303
[
4.5%
-
5.0%
]
4.72%
25,535$115,118
[
4.5%
-
5.0%
]
4.88%
3,748$98,220
[
5.0%
-
5.5%
]
5.22%
1,974$108,170
[
5.0%
-
5.5%
]
5.36%
261$61,681
[
6.0%
-
6.5%
]
6.07%
4,758$121,388
[
6.0%
-
6.5%
]
6.27%
1,642$37,991
[
6.5%
-
7.0%
]
6.65%
857$67,550
[
6.5%
-
7.0%
]
6.77%
1,388$100,185
[
7.0%
-
7.5%
]
7.27%
1,211$88,557
[
7.5%
-
8.0%
]
7.55%
1,669$74,712
[
8.0%
-
8.5%
]
8.29%
5,262$62,337
[
9.0%
-
9.5%
]
9.30%
172$104,167
[
9.0%
-
9.5%
]
9.34%
578$55,417
[
9.5%
-
10.0%
]
9.70%
402$139,063
[
10.5%
-
11.0%
]
10.74%
121$58,750
[
12.0%
-
12.5%
]
12.46%
313$161,250
[
16.0%
-
16.5%
]
16.19%
105$125,250