Guamanian/Chamorro 2 or more Vehicles in Household

COMPARE

Guamanian/Chamorro
Race
Ancestry
AfghanAfricanAlaska NativeAlaskan AthabascanAlbanianAleutAlsatianAmericanApacheArabArapahoArgentineanArmenianAssyrian/Chaldean/SyriacAustralianAustrianBahamianBangladeshiBarbadianBasqueBelgianBelizeanBermudanBhutaneseBlackfeetBolivianBrazilianBritishBritish West IndianBulgarianBurmeseCajunCambodianCanadianCape VerdeanCarpatho RusynCelticCentral AmericanCentral American IndianCherokeeCheyenneChickasawChileanChineseChippewaChoctawColombianColvilleComancheCosta RicanCreeCreekCroatianCrowCubanCypriotCzechCzechoslovakianDanishDelawareDominicanDutchDutch West IndianEastern EuropeanEcuadorianEgyptianEnglishEstonianEthiopianEuropeanFijianFilipinoFinnishFrenchFrench American IndianFrench CanadianGermanGerman RussianGhanaianGreekGuamanian/ChamorroGuatemalanGuyaneseHaitianHmongHonduranHopiHoumaHungarianIcelanderIndian (Asian)IndonesianInupiatIranianIraqiIrishIroquoisIsraeliItalianJamaicanJapaneseJordanianKenyanKiowaKoreanLaotianLatvianLebaneseLiberianLithuanianLumbeeLuxembourgerMacedonianMalaysianMalteseMarshalleseMenomineeMexicanMexican American IndianMongolianMoroccanNative HawaiianNavajoNepaleseNew ZealanderNicaraguanNigerianNorthern EuropeanNorwegianOkinawanOsageOttawaPaiutePakistaniPalestinianPanamanianParaguayanPennsylvania GermanPeruvianPimaPolishPortuguesePotawatomiPuebloPuerto RicanPuget Sound SalishRomanianRussianSalvadoranSamoanScandinavianScotch-IrishScottishSeminoleSenegaleseSerbianShoshoneSierra LeoneanSiouxSlavicSlovakSloveneSomaliSouth AfricanSouth AmericanSouth American IndianSoviet UnionSpaniardSpanishSpanish AmericanSpanish American IndianSri LankanSubsaharan AfricanSudaneseSwedishSwissSyrianTaiwaneseThaiTlingit-HaidaTohono O'OdhamTonganTrinidadian and TobagonianTsimshianTurkishU.S. Virgin IslanderUgandanUkrainianUruguayanUteVenezuelanVietnameseWelshWest IndianYakamaYaquiYugoslavianYumanYup'ikZimbabwean
Immigration
NonimmigrantsImmigrantsAfghanistanAfricaAlbaniaArgentinaArmeniaAsiaAustraliaAustriaBahamasBangladeshBarbadosBelarusBelgiumBelizeBoliviaBosnia and HerzegovinaBrazilBulgariaBurma/MyanmarCabo VerdeCambodiaCameroonCanadaCaribbeanCentral AmericaChileChinaColombiaCongoCosta RicaCroatiaCubaCzechoslovakiaDenmarkDominicaDominican RepublicEastern AfricaEastern AsiaEastern EuropeEcuadorEgyptEl SalvadorEnglandEritreaEthiopiaEuropeFijiFranceGermanyGhanaGreeceGrenadaGuatemalaGuyanaHaitiHondurasHong KongHungaryIndiaIndonesiaIranIraqIrelandIsraelItalyJamaicaJapanJordanKazakhstanKenyaKoreaKuwaitLaosLatin AmericaLatviaLebanonLiberiaLithuaniaMalaysiaMexicoMicronesiaMiddle AfricaMoldovaMoroccoNepalNetherlandsNicaraguaNigeriaNorth AmericaNorth MacedoniaNorthern AfricaNorthern EuropeNorwayOceaniaPakistanPanamaPeruPhilippinesPolandPortugalRomaniaRussiaSaudi ArabiaScotlandSenegalSerbiaSierra LeoneSingaporeSomaliaSouth AfricaSouth AmericaSouth Central AsiaSouth Eastern AsiaSouthern EuropeSpainSri LankaSt. Vincent and the GrenadinesSudanSwedenSwitzerlandSyriaTaiwanThailandTrinidad and TobagoTurkeyUgandaUkraineUruguayUzbekistanVenezuelaVietnamWest IndiesWestern AfricaWestern AsiaWestern EuropeYemenZaireZimbabweAzores
Select to Compare
Race
Ancestry
AfghanAfricanAlaska NativeAlaskan AthabascanAlbanianAleutAlsatianAmericanApacheArabArapahoArgentineanArmenianAssyrian/Chaldean/SyriacAustralianAustrianBahamianBangladeshiBarbadianBasqueBelgianBelizeanBermudanBhutaneseBlackfeetBolivianBrazilianBritishBritish West IndianBulgarianBurmeseCajunCambodianCanadianCape VerdeanCarpatho RusynCelticCentral AmericanCentral American IndianCherokeeCheyenneChickasawChileanChineseChippewaChoctawColombianColvilleComancheCosta RicanCreeCreekCroatianCrowCubanCypriotCzechCzechoslovakianDanishDelawareDominicanDutchDutch West IndianEastern EuropeanEcuadorianEgyptianEnglishEstonianEthiopianEuropeanFijianFilipinoFinnishFrenchFrench American IndianFrench CanadianGermanGerman RussianGhanaianGreekGuatemalanGuyaneseHaitianHmongHonduranHopiHoumaHungarianIcelanderIndian (Asian)IndonesianInupiatIranianIraqiIrishIroquoisIsraeliItalianJamaicanJapaneseJordanianKenyanKiowaKoreanLaotianLatvianLebaneseLiberianLithuanianLumbeeLuxembourgerMacedonianMalaysianMalteseMarshalleseMenomineeMexicanMexican American IndianMongolianMoroccanNative HawaiianNavajoNepaleseNew ZealanderNicaraguanNigerianNorthern EuropeanNorwegianOkinawanOsageOttawaPaiutePakistaniPalestinianPanamanianParaguayanPennsylvania GermanPeruvianPimaPolishPortuguesePotawatomiPuebloPuerto RicanPuget Sound SalishRomanianRussianSalvadoranSamoanScandinavianScotch-IrishScottishSeminoleSenegaleseSerbianShoshoneSierra LeoneanSiouxSlavicSlovakSloveneSomaliSouth AfricanSouth AmericanSouth American IndianSoviet UnionSpaniardSpanishSpanish AmericanSpanish American IndianSri LankanSubsaharan AfricanSudaneseSwedishSwissSyrianTaiwaneseThaiTlingit-HaidaTohono O'OdhamTonganTrinidadian and TobagonianTsimshianTurkishU.S. Virgin IslanderUgandanUkrainianUruguayanUteVenezuelanVietnameseWelshWest IndianYakamaYaquiYugoslavianYumanYup'ikZimbabwean
Immigration
NonimmigrantsImmigrantsAfghanistanAfricaAlbaniaArgentinaArmeniaAsiaAustraliaAustriaBahamasBangladeshBarbadosBelarusBelgiumBelizeBoliviaBosnia and HerzegovinaBrazilBulgariaBurma/MyanmarCabo VerdeCambodiaCameroonCanadaCaribbeanCentral AmericaChileChinaColombiaCongoCosta RicaCroatiaCubaCzechoslovakiaDenmarkDominicaDominican RepublicEastern AfricaEastern AsiaEastern EuropeEcuadorEgyptEl SalvadorEnglandEritreaEthiopiaEuropeFijiFranceGermanyGhanaGreeceGrenadaGuatemalaGuyanaHaitiHondurasHong KongHungaryIndiaIndonesiaIranIraqIrelandIsraelItalyJamaicaJapanJordanKazakhstanKenyaKoreaKuwaitLaosLatin AmericaLatviaLebanonLiberiaLithuaniaMalaysiaMexicoMicronesiaMiddle AfricaMoldovaMoroccoNepalNetherlandsNicaraguaNigeriaNorth AmericaNorth MacedoniaNorthern AfricaNorthern EuropeNorwayOceaniaPakistanPanamaPeruPhilippinesPolandPortugalRomaniaRussiaSaudi ArabiaScotlandSenegalSerbiaSierra LeoneSingaporeSomaliaSouth AfricaSouth AmericaSouth Central AsiaSouth Eastern AsiaSouthern EuropeSpainSri LankaSt. Vincent and the GrenadinesSudanSwedenSwitzerlandSyriaTaiwanThailandTrinidad and TobagoTurkeyUgandaUkraineUruguayUzbekistanVenezuelaVietnamWest IndiesWestern AfricaWestern AsiaWestern EuropeYemenZaireZimbabweAzores
2 or more Vehicles in Household
Income
Poverty
Unemployment
Labor Participation
Family Structure
Vehicle Availability
Education Level
Disability

Guamanian/Chamorro 2 or more Vehicles in Household
Exceptional

60.5%
2+ VEHICLES AVAILABLE
100.0/ 100
METRIC RATING
28th/ 347
METRIC RANK

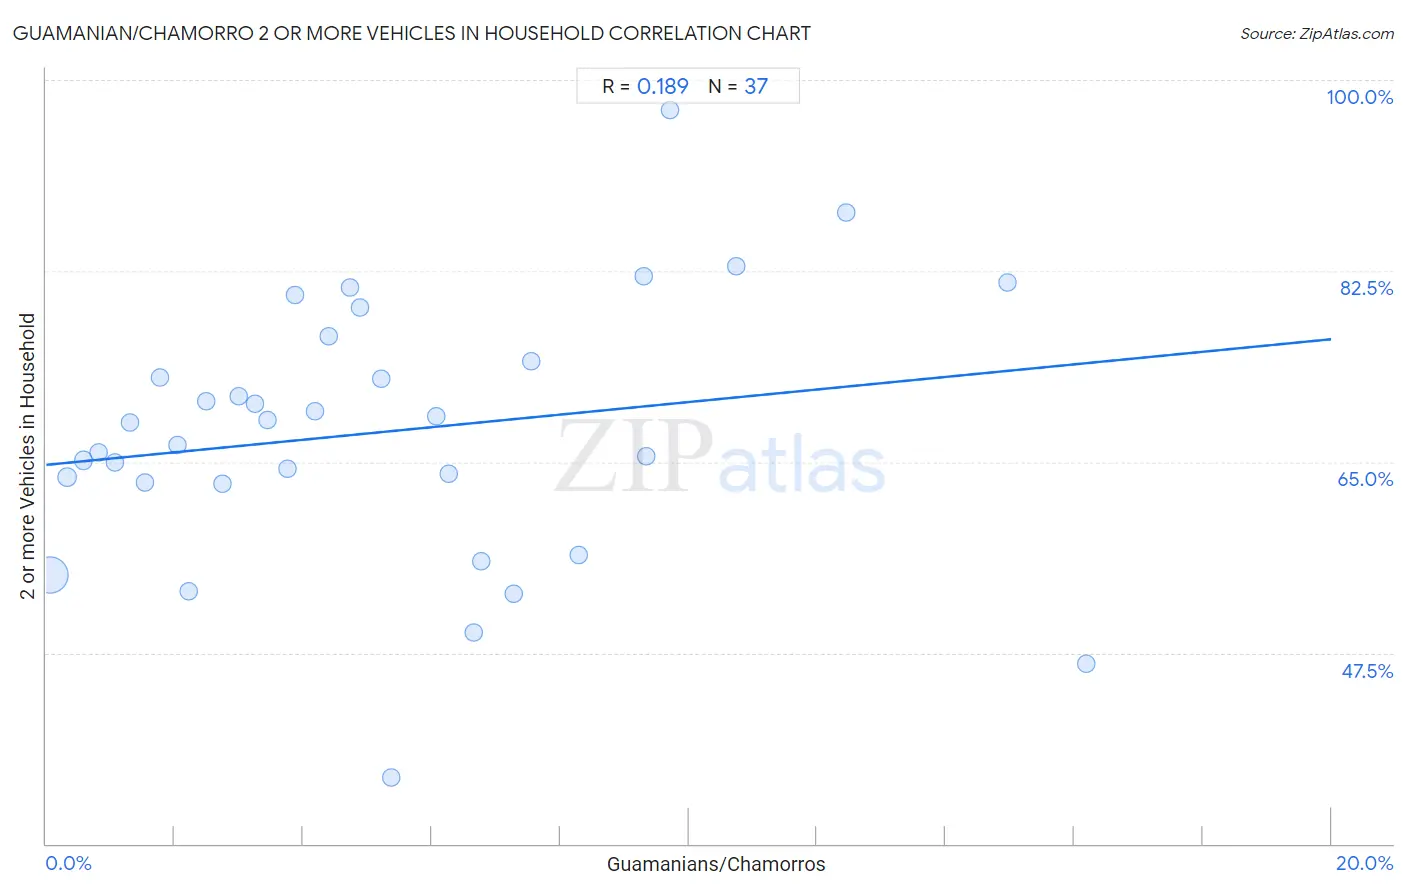
Guamanian/Chamorro 2 or more Vehicles in Household Correlation Chart

The statistical analysis conducted on geographies consisting of 221,880,536 people shows a poor positive correlation between the proportion of Guamanians/Chamorros and percentage of households with 2 or more vehicles available in the United States with a correlation coefficient (R) of 0.189 and weighted average of 60.5%. On average, for every 1% (one percent) increase in Guamanians/Chamorros within a typical geography, there is an increase of 0.58% in percentage of households with 2 or more vehicles available.
Guamanian/Chamorro 2 or more Vehicles in Household
It is essential to understand that the correlation between the percentage of Guamanians/Chamorros and percentage of households with 2 or more vehicles available does not imply a direct cause-and-effect relationship. It remains uncertain whether the presence of Guamanians/Chamorros influences an upward or downward trend in the level of percentage of households with 2 or more vehicles available within an area, or if Guamanians/Chamorros simply ended up residing in those areas with higher or lower levels of percentage of households with 2 or more vehicles available due to other factors.

Demographics Similar to Guamanians/Chamorros by 2 or more Vehicles in Household

In terms of 2 or more vehicles in household, the demographic groups most similar to Guamanians/Chamorros are Hawaiian (60.4%, a difference of 0.11%), Assyrian/Chaldean/Syriac (60.5%, a difference of 0.13%), Finnish (60.3%, a difference of 0.24%), Spanish American Indian (60.3%, a difference of 0.26%), and Arapaho (60.2%, a difference of 0.37%).
DemographicsRating | Rank2 or more Vehicles in Household
Koreans
100.0
/100
|
#21
Exceptional
61.0%
Swiss
100.0
/100
|
#22
Exceptional
61.0%
Scotch-Irish
100.0
/100
|
#23
Exceptional
60.9%
Immigrants from Vietnam
100.0
/100
|
#24
Exceptional
60.9%
Whites/Caucasians
100.0
/100
|
#25
Exceptional
60.8%
Welsh
100.0
/100
|
#26
Exceptional
60.8%
Assyrians/Chaldeans/Syriacs
100.0
/100
|
#27
Exceptional
60.5%
Guamanians/Chamorros
100.0
/100
|
#28
Exceptional
60.5%
Hawaiians
100.0
/100
|
#29
Exceptional
60.4%
Finns
100.0
/100
|
#30
Exceptional
60.3%
Spanish American Indians
100.0
/100
|
#31
Exceptional
60.3%
Arapaho
100.0
/100
|
#32
Exceptional
60.2%
Immigrants from Mexico
100.0
/100
|
#33
Exceptional
60.2%
Spanish
100.0
/100
|
#34
Exceptional
60.2%
Immigrants from Philippines
100.0
/100
|
#35
Exceptional
60.1%

Guamanian/Chamorro 2 or more Vehicles in Household Correlation Summary

MeasurementGuamanian/Chamorro Data2 or more Vehicles in Household Data
Minimum0.066%36.1%
Maximum16.2%97.2%
Range16.1%61.2%
Mean5.3%67.8%
Median4.4%68.6%
Interquartile 25% (IQ1)2.1%63.0%
Interquartile 75% (IQ3)7.4%75.3%
Interquartile Range (IQR)5.3%12.3%
Standard Deviation (Sample)4.0%12.2%
Standard Deviation (Population)3.9%12.0%

Correlation Details

Guamanian/Chamorro PercentileSample Size2 or more Vehicles in Household
[
0.0%
-
0.5%
]
0.066%
190,836,62654.6%
[
0.0%
-
0.5%
]
0.33%
20,066,56663.6%
[
0.5%
-
1.0%
]
0.58%
5,624,04665.1%
[
0.5%
-
1.0%
]
0.82%
2,549,88565.9%
[
1.0%
-
1.5%
]
1.08%
1,254,74964.9%
[
1.0%
-
1.5%
]
1.29%
477,45968.6%
[
1.5%
-
2.0%
]
1.54%
409,37563.1%
[
1.5%
-
2.0%
]
1.78%
203,35072.7%
[
2.0%
-
2.5%
]
2.04%
135,54966.5%
[
2.0%
-
2.5%
]
2.22%
66,56453.1%
[
2.0%
-
2.5%
]
2.49%
49,70370.6%
[
2.5%
-
3.0%
]
2.74%
24,71263.0%
[
2.5%
-
3.0%
]
2.99%
30,24171.0%
[
3.0%
-
3.5%
]
3.26%
27,98870.3%
[
3.0%
-
3.5%
]
3.45%
45,98468.9%
[
3.5%
-
4.0%
]
3.75%
9,68064.4%
[
3.5%
-
4.0%
]
3.86%
4,60880.3%
[
4.0%
-
4.5%
]
4.19%
7,78269.7%
[
4.0%
-
4.5%
]
4.41%
5,37976.5%
[
4.5%
-
5.0%
]
4.72%
25,53580.9%
[
4.5%
-
5.0%
]
4.88%
3,74879.2%
[
5.0%
-
5.5%
]
5.22%
1,97472.6%
[
5.0%
-
5.5%
]
5.36%
26136.1%
[
6.0%
-
6.5%
]
6.07%
4,75869.2%
[
6.0%
-
6.5%
]
6.27%
1,64264.0%
[
6.5%
-
7.0%
]
6.65%
85749.4%
[
6.5%
-
7.0%
]
6.77%
1,38855.9%
[
7.0%
-
7.5%
]
7.27%
1,21152.9%
[
7.5%
-
8.0%
]
7.55%
1,66974.2%
[
8.0%
-
8.5%
]
8.29%
5,26256.5%
[
9.0%
-
9.5%
]
9.30%
17282.0%
[
9.0%
-
9.5%
]
9.34%
57865.5%
[
9.5%
-
10.0%
]
9.70%
40297.2%
[
10.5%
-
11.0%
]
10.74%
12182.9%
[
12.0%
-
12.5%
]
12.46%
31387.9%
[
14.5%
-
15.0%
]
14.97%
29481.5%
[
16.0%
-
16.5%
]
16.19%
10546.5%