Ukrainian Married-couple Households

COMPARE

Ukrainian
Race
Ancestry
AfghanAfricanAlaska NativeAlaskan AthabascanAlbanianAleutAlsatianAmericanApacheArabArapahoArgentineanArmenianAssyrian/Chaldean/SyriacAustralianAustrianBahamianBangladeshiBarbadianBasqueBelgianBelizeanBermudanBhutaneseBlackfeetBolivianBrazilianBritishBritish West IndianBulgarianBurmeseCajunCambodianCanadianCape VerdeanCarpatho RusynCelticCentral AmericanCentral American IndianCherokeeCheyenneChickasawChileanChineseChippewaChoctawColombianColvilleComancheCosta RicanCreeCreekCroatianCrowCubanCypriotCzechCzechoslovakianDanishDelawareDominicanDutchDutch West IndianEastern EuropeanEcuadorianEgyptianEnglishEstonianEthiopianEuropeanFijianFilipinoFinnishFrenchFrench American IndianFrench CanadianGermanGerman RussianGhanaianGreekGuamanian/ChamorroGuatemalanGuyaneseHaitianHmongHonduranHopiHoumaHungarianIcelanderIndian (Asian)IndonesianInupiatIranianIraqiIrishIroquoisIsraeliItalianJamaicanJapaneseJordanianKenyanKiowaKoreanLaotianLatvianLebaneseLiberianLithuanianLumbeeLuxembourgerMacedonianMalaysianMalteseMarshalleseMenomineeMexicanMexican American IndianMongolianMoroccanNative HawaiianNavajoNepaleseNew ZealanderNicaraguanNigerianNorthern EuropeanNorwegianOkinawanOsageOttawaPaiutePakistaniPalestinianPanamanianParaguayanPennsylvania GermanPeruvianPimaPolishPortuguesePotawatomiPuebloPuerto RicanPuget Sound SalishRomanianRussianSalvadoranSamoanScandinavianScotch-IrishScottishSeminoleSenegaleseSerbianShoshoneSierra LeoneanSiouxSlavicSlovakSloveneSomaliSouth AfricanSouth AmericanSouth American IndianSoviet UnionSpaniardSpanishSpanish AmericanSpanish American IndianSri LankanSubsaharan AfricanSudaneseSwedishSwissSyrianTaiwaneseThaiTlingit-HaidaTohono O'OdhamTonganTrinidadian and TobagonianTsimshianTurkishU.S. Virgin IslanderUgandanUkrainianUruguayanUteVenezuelanVietnameseWelshWest IndianYakamaYaquiYugoslavianYumanYup'ikZimbabwean
Immigration
NonimmigrantsImmigrantsAfghanistanAfricaAlbaniaArgentinaArmeniaAsiaAustraliaAustriaBahamasBangladeshBarbadosBelarusBelgiumBelizeBoliviaBosnia and HerzegovinaBrazilBulgariaBurma/MyanmarCabo VerdeCambodiaCameroonCanadaCaribbeanCentral AmericaChileChinaColombiaCongoCosta RicaCroatiaCubaCzechoslovakiaDenmarkDominicaDominican RepublicEastern AfricaEastern AsiaEastern EuropeEcuadorEgyptEl SalvadorEnglandEritreaEthiopiaEuropeFijiFranceGermanyGhanaGreeceGrenadaGuatemalaGuyanaHaitiHondurasHong KongHungaryIndiaIndonesiaIranIraqIrelandIsraelItalyJamaicaJapanJordanKazakhstanKenyaKoreaKuwaitLaosLatin AmericaLatviaLebanonLiberiaLithuaniaMalaysiaMexicoMicronesiaMiddle AfricaMoldovaMoroccoNepalNetherlandsNicaraguaNigeriaNorth AmericaNorth MacedoniaNorthern AfricaNorthern EuropeNorwayOceaniaPakistanPanamaPeruPhilippinesPolandPortugalRomaniaRussiaSaudi ArabiaScotlandSenegalSerbiaSierra LeoneSingaporeSomaliaSouth AfricaSouth AmericaSouth Central AsiaSouth Eastern AsiaSouthern EuropeSpainSri LankaSt. Vincent and the GrenadinesSudanSwedenSwitzerlandSyriaTaiwanThailandTrinidad and TobagoTurkeyUgandaUkraineUruguayUzbekistanVenezuelaVietnamWest IndiesWestern AfricaWestern AsiaWestern EuropeYemenZaireZimbabweAzores
Select to Compare
Race
Ancestry
AfghanAfricanAlaska NativeAlaskan AthabascanAlbanianAleutAlsatianAmericanApacheArabArapahoArgentineanArmenianAssyrian/Chaldean/SyriacAustralianAustrianBahamianBangladeshiBarbadianBasqueBelgianBelizeanBermudanBhutaneseBlackfeetBolivianBrazilianBritishBritish West IndianBulgarianBurmeseCajunCambodianCanadianCape VerdeanCarpatho RusynCelticCentral AmericanCentral American IndianCherokeeCheyenneChickasawChileanChineseChippewaChoctawColombianColvilleComancheCosta RicanCreeCreekCroatianCrowCubanCypriotCzechCzechoslovakianDanishDelawareDominicanDutchDutch West IndianEastern EuropeanEcuadorianEgyptianEnglishEstonianEthiopianEuropeanFijianFilipinoFinnishFrenchFrench American IndianFrench CanadianGermanGerman RussianGhanaianGreekGuamanian/ChamorroGuatemalanGuyaneseHaitianHmongHonduranHopiHoumaHungarianIcelanderIndian (Asian)IndonesianInupiatIranianIraqiIrishIroquoisIsraeliItalianJamaicanJapaneseJordanianKenyanKiowaKoreanLaotianLatvianLebaneseLiberianLithuanianLumbeeLuxembourgerMacedonianMalaysianMalteseMarshalleseMenomineeMexicanMexican American IndianMongolianMoroccanNative HawaiianNavajoNepaleseNew ZealanderNicaraguanNigerianNorthern EuropeanNorwegianOkinawanOsageOttawaPaiutePakistaniPalestinianPanamanianParaguayanPennsylvania GermanPeruvianPimaPolishPortuguesePotawatomiPuebloPuerto RicanPuget Sound SalishRomanianRussianSalvadoranSamoanScandinavianScotch-IrishScottishSeminoleSenegaleseSerbianShoshoneSierra LeoneanSiouxSlavicSlovakSloveneSomaliSouth AfricanSouth AmericanSouth American IndianSoviet UnionSpaniardSpanishSpanish AmericanSpanish American IndianSri LankanSubsaharan AfricanSudaneseSwedishSwissSyrianTaiwaneseThaiTlingit-HaidaTohono O'OdhamTonganTrinidadian and TobagonianTsimshianTurkishU.S. Virgin IslanderUgandanUruguayanUteVenezuelanVietnameseWelshWest IndianYakamaYaquiYugoslavianYumanYup'ikZimbabwean
Immigration
NonimmigrantsImmigrantsAfghanistanAfricaAlbaniaArgentinaArmeniaAsiaAustraliaAustriaBahamasBangladeshBarbadosBelarusBelgiumBelizeBoliviaBosnia and HerzegovinaBrazilBulgariaBurma/MyanmarCabo VerdeCambodiaCameroonCanadaCaribbeanCentral AmericaChileChinaColombiaCongoCosta RicaCroatiaCubaCzechoslovakiaDenmarkDominicaDominican RepublicEastern AfricaEastern AsiaEastern EuropeEcuadorEgyptEl SalvadorEnglandEritreaEthiopiaEuropeFijiFranceGermanyGhanaGreeceGrenadaGuatemalaGuyanaHaitiHondurasHong KongHungaryIndiaIndonesiaIranIraqIrelandIsraelItalyJamaicaJapanJordanKazakhstanKenyaKoreaKuwaitLaosLatin AmericaLatviaLebanonLiberiaLithuaniaMalaysiaMexicoMicronesiaMiddle AfricaMoldovaMoroccoNepalNetherlandsNicaraguaNigeriaNorth AmericaNorth MacedoniaNorthern AfricaNorthern EuropeNorwayOceaniaPakistanPanamaPeruPhilippinesPolandPortugalRomaniaRussiaSaudi ArabiaScotlandSenegalSerbiaSierra LeoneSingaporeSomaliaSouth AfricaSouth AmericaSouth Central AsiaSouth Eastern AsiaSouthern EuropeSpainSri LankaSt. Vincent and the GrenadinesSudanSwedenSwitzerlandSyriaTaiwanThailandTrinidad and TobagoTurkeyUgandaUkraineUruguayUzbekistanVenezuelaVietnamWest IndiesWestern AfricaWestern AsiaWestern EuropeYemenZaireZimbabweAzores
Married-couple Households
Income
Poverty
Unemployment
Labor Participation
Family Structure
Vehicle Availability
Education Level
Disability

Ukrainian Married-couple Households
Exceptional

48.1%
MARRIED-COUPLE HOUSEHOLDS
97.6/ 100
METRIC RATING
84th/ 347
METRIC RANK

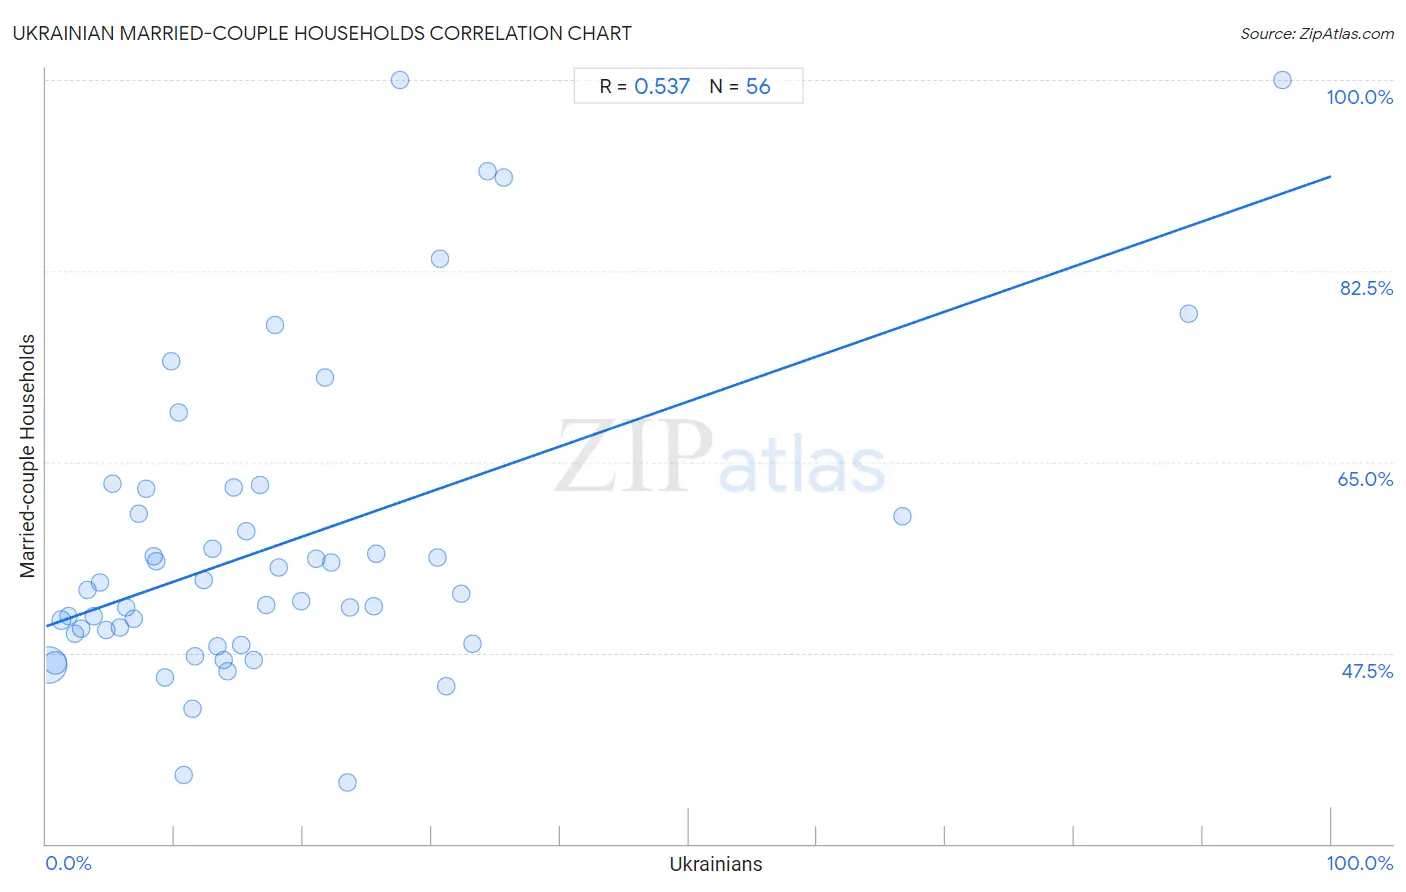
Ukrainian Married-couple Households Correlation Chart

The statistical analysis conducted on geographies consisting of 448,301,259 people shows a substantial positive correlation between the proportion of Ukrainians and percentage of married-couple family households in the United States with a correlation coefficient (R) of 0.537 and weighted average of 48.1%. On average, for every 1% (one percent) increase in Ukrainians within a typical geography, there is an increase of 0.41% in percentage of married-couple family households.
Ukrainian Married-couple Households
It is essential to understand that the correlation between the percentage of Ukrainians and percentage of married-couple family households does not imply a direct cause-and-effect relationship. It remains uncertain whether the presence of Ukrainians influences an upward or downward trend in the level of percentage of married-couple family households within an area, or if Ukrainians simply ended up residing in those areas with higher or lower levels of percentage of married-couple family households due to other factors.

Demographics Similar to Ukrainians by Married-couple Households

In terms of married-couple households, the demographic groups most similar to Ukrainians are Guamanian/Chamorro (48.1%, a difference of 0.020%), Immigrants from Poland (48.1%, a difference of 0.040%), Immigrants from Israel (48.0%, a difference of 0.050%), Belgian (48.0%, a difference of 0.070%), and Immigrants from Ireland (48.0%, a difference of 0.080%).
DemographicsRating | RankMarried-couple Households
Canadians
98.2
/100
|
#77
Exceptional
48.2%
Egyptians
98.2
/100
|
#78
Exceptional
48.2%
Immigrants from Netherlands
98.2
/100
|
#79
Exceptional
48.2%
Russians
98.1
/100
|
#80
Exceptional
48.2%
Finns
98.0
/100
|
#81
Exceptional
48.1%
Immigrants from Poland
97.7
/100
|
#82
Exceptional
48.1%
Guamanians/Chamorros
97.6
/100
|
#83
Exceptional
48.1%
Ukrainians
97.6
/100
|
#84
Exceptional
48.1%
Immigrants from Israel
97.4
/100
|
#85
Exceptional
48.0%
Belgians
97.4
/100
|
#86
Exceptional
48.0%
Immigrants from Ireland
97.3
/100
|
#87
Exceptional
48.0%
Afghans
97.3
/100
|
#88
Exceptional
48.0%
Cypriots
97.2
/100
|
#89
Exceptional
48.0%
French
97.2
/100
|
#90
Exceptional
48.0%
Immigrants from Moldova
97.0
/100
|
#91
Exceptional
48.0%

Ukrainian Married-couple Households Correlation Summary

MeasurementUkrainian DataMarried-couple Households Data
Minimum0.19%35.6%
Maximum96.2%100.0%
Range96.0%64.4%
Mean18.4%57.5%
Median13.9%53.1%
Interquartile 25% (IQ1)7.0%48.8%
Interquartile 75% (IQ3)23.5%61.3%
Interquartile Range (IQR)16.5%12.5%
Standard Deviation (Sample)18.7%14.4%
Standard Deviation (Population)18.5%14.2%

Correlation Details

Ukrainian PercentileSample SizeMarried-couple Households
[
0.0%
-
0.5%
]
0.19%
334,524,93646.3%
[
0.5%
-
1.0%
]
0.70%
78,064,21646.6%
[
1.0%
-
1.5%
]
1.19%
19,131,38750.5%
[
1.5%
-
2.0%
]
1.73%
7,973,12950.9%
[
2.0%
-
2.5%
]
2.24%
2,918,27849.3%
[
2.5%
-
3.0%
]
2.70%
2,330,15149.7%
[
3.0%
-
3.5%
]
3.25%
708,22353.3%
[
3.5%
-
4.0%
]
3.73%
803,01750.9%
[
4.0%
-
4.5%
]
4.20%
383,23253.9%
[
4.5%
-
5.0%
]
4.68%
384,75849.6%
[
5.0%
-
5.5%
]
5.19%
142,40863.0%
[
5.5%
-
6.0%
]
5.76%
306,10749.8%
[
6.0%
-
6.5%
]
6.20%
146,82251.7%
[
6.5%
-
7.0%
]
6.82%
105,36050.6%
[
7.0%
-
7.5%
]
7.17%
75,10760.2%
[
7.5%
-
8.0%
]
7.81%
8,69862.5%
[
8.0%
-
8.5%
]
8.37%
88,11756.3%
[
8.5%
-
9.0%
]
8.56%
56,96355.9%
[
9.0%
-
9.5%
]
9.23%
12,60345.3%
[
9.5%
-
10.0%
]
9.71%
11,56474.2%
[
10.0%
-
10.5%
]
10.30%
7,03069.6%
[
10.5%
-
11.0%
]
10.73%
5,07836.3%
[
11.0%
-
11.5%
]
11.36%
54642.4%
[
11.5%
-
12.0%
]
11.61%
85,95947.2%
[
12.0%
-
12.5%
]
12.22%
2,62654.1%
[
12.5%
-
13.0%
]
12.89%
2,07957.1%
[
13.0%
-
13.5%
]
13.37%
3,58948.1%
[
13.5%
-
14.0%
]
13.78%
31246.9%
[
14.0%
-
14.5%
]
14.07%
2,09745.9%
[
14.5%
-
15.0%
]
14.58%
1,36562.7%
[
15.0%
-
15.5%
]
15.15%
1,09648.2%
[
15.5%
-
16.0%
]
15.58%
1,34858.6%
[
16.0%
-
16.5%
]
16.17%
3,03146.9%
[
16.5%
-
17.0%
]
16.60%
47662.9%
[
17.0%
-
17.5%
]
17.10%
69051.8%
[
17.5%
-
18.0%
]
17.78%
47877.6%
[
18.0%
-
18.5%
]
18.08%
1,02355.3%
[
19.5%
-
20.0%
]
19.85%
1,35552.3%
[
20.5%
-
21.0%
]
21.00%
58156.1%
[
21.5%
-
22.0%
]
21.69%
16672.8%
[
22.0%
-
22.5%
]
22.16%
38855.8%
[
23.0%
-
23.5%
]
23.42%
22235.6%
[
23.5%
-
24.0%
]
23.67%
30051.6%
[
25.0%
-
25.5%
]
25.46%
49151.7%
[
25.5%
-
26.0%
]
25.65%
38256.6%
[
27.0%
-
27.5%
]
27.50%
40100.0%
[
30.0%
-
30.5%
]
30.43%
4656.2%
[
30.5%
-
31.0%
]
30.60%
97483.6%
[
31.0%
-
31.5%
]
31.13%
25744.4%
[
32.0%
-
32.5%
]
32.26%
15552.9%
[
33.0%
-
33.5%
]
33.14%
1,53648.3%
[
34.0%
-
34.5%
]
34.38%
6491.7%
[
35.5%
-
36.0%
]
35.59%
28191.1%
[
66.5%
-
67.0%
]
66.67%
4260.0%
[
88.5%
-
89.0%
]
88.89%
2778.6%
[
96.0%
-
96.5%
]
96.23%
53100.0%