Ukrainian 2 or more Vehicles in Household

COMPARE

Ukrainian
Race
Ancestry
AfghanAfricanAlaska NativeAlaskan AthabascanAlbanianAleutAlsatianAmericanApacheArabArapahoArgentineanArmenianAssyrian/Chaldean/SyriacAustralianAustrianBahamianBangladeshiBarbadianBasqueBelgianBelizeanBermudanBhutaneseBlackfeetBolivianBrazilianBritishBritish West IndianBulgarianBurmeseCajunCambodianCanadianCape VerdeanCarpatho RusynCelticCentral AmericanCentral American IndianCherokeeCheyenneChickasawChileanChineseChippewaChoctawColombianColvilleComancheCosta RicanCreeCreekCroatianCrowCubanCypriotCzechCzechoslovakianDanishDelawareDominicanDutchDutch West IndianEastern EuropeanEcuadorianEgyptianEnglishEstonianEthiopianEuropeanFijianFilipinoFinnishFrenchFrench American IndianFrench CanadianGermanGerman RussianGhanaianGreekGuamanian/ChamorroGuatemalanGuyaneseHaitianHmongHonduranHopiHoumaHungarianIcelanderIndian (Asian)IndonesianInupiatIranianIraqiIrishIroquoisIsraeliItalianJamaicanJapaneseJordanianKenyanKiowaKoreanLaotianLatvianLebaneseLiberianLithuanianLumbeeLuxembourgerMacedonianMalaysianMalteseMarshalleseMenomineeMexicanMexican American IndianMongolianMoroccanNative HawaiianNavajoNepaleseNew ZealanderNicaraguanNigerianNorthern EuropeanNorwegianOkinawanOsageOttawaPaiutePakistaniPalestinianPanamanianParaguayanPennsylvania GermanPeruvianPimaPolishPortuguesePotawatomiPuebloPuerto RicanPuget Sound SalishRomanianRussianSalvadoranSamoanScandinavianScotch-IrishScottishSeminoleSenegaleseSerbianShoshoneSierra LeoneanSiouxSlavicSlovakSloveneSomaliSouth AfricanSouth AmericanSouth American IndianSoviet UnionSpaniardSpanishSpanish AmericanSpanish American IndianSri LankanSubsaharan AfricanSudaneseSwedishSwissSyrianTaiwaneseThaiTlingit-HaidaTohono O'OdhamTonganTrinidadian and TobagonianTsimshianTurkishU.S. Virgin IslanderUgandanUkrainianUruguayanUteVenezuelanVietnameseWelshWest IndianYakamaYaquiYugoslavianYumanYup'ikZimbabwean
Immigration
NonimmigrantsImmigrantsAfghanistanAfricaAlbaniaArgentinaArmeniaAsiaAustraliaAustriaBahamasBangladeshBarbadosBelarusBelgiumBelizeBoliviaBosnia and HerzegovinaBrazilBulgariaBurma/MyanmarCabo VerdeCambodiaCameroonCanadaCaribbeanCentral AmericaChileChinaColombiaCongoCosta RicaCroatiaCubaCzechoslovakiaDenmarkDominicaDominican RepublicEastern AfricaEastern AsiaEastern EuropeEcuadorEgyptEl SalvadorEnglandEritreaEthiopiaEuropeFijiFranceGermanyGhanaGreeceGrenadaGuatemalaGuyanaHaitiHondurasHong KongHungaryIndiaIndonesiaIranIraqIrelandIsraelItalyJamaicaJapanJordanKazakhstanKenyaKoreaKuwaitLaosLatin AmericaLatviaLebanonLiberiaLithuaniaMalaysiaMexicoMicronesiaMiddle AfricaMoldovaMoroccoNepalNetherlandsNicaraguaNigeriaNorth AmericaNorth MacedoniaNorthern AfricaNorthern EuropeNorwayOceaniaPakistanPanamaPeruPhilippinesPolandPortugalRomaniaRussiaSaudi ArabiaScotlandSenegalSerbiaSierra LeoneSingaporeSomaliaSouth AfricaSouth AmericaSouth Central AsiaSouth Eastern AsiaSouthern EuropeSpainSri LankaSt. Vincent and the GrenadinesSudanSwedenSwitzerlandSyriaTaiwanThailandTrinidad and TobagoTurkeyUgandaUkraineUruguayUzbekistanVenezuelaVietnamWest IndiesWestern AfricaWestern AsiaWestern EuropeYemenZaireZimbabweAzores
Select to Compare
Race
Ancestry
AfghanAfricanAlaska NativeAlaskan AthabascanAlbanianAleutAlsatianAmericanApacheArabArapahoArgentineanArmenianAssyrian/Chaldean/SyriacAustralianAustrianBahamianBangladeshiBarbadianBasqueBelgianBelizeanBermudanBhutaneseBlackfeetBolivianBrazilianBritishBritish West IndianBulgarianBurmeseCajunCambodianCanadianCape VerdeanCarpatho RusynCelticCentral AmericanCentral American IndianCherokeeCheyenneChickasawChileanChineseChippewaChoctawColombianColvilleComancheCosta RicanCreeCreekCroatianCrowCubanCypriotCzechCzechoslovakianDanishDelawareDominicanDutchDutch West IndianEastern EuropeanEcuadorianEgyptianEnglishEstonianEthiopianEuropeanFijianFilipinoFinnishFrenchFrench American IndianFrench CanadianGermanGerman RussianGhanaianGreekGuamanian/ChamorroGuatemalanGuyaneseHaitianHmongHonduranHopiHoumaHungarianIcelanderIndian (Asian)IndonesianInupiatIranianIraqiIrishIroquoisIsraeliItalianJamaicanJapaneseJordanianKenyanKiowaKoreanLaotianLatvianLebaneseLiberianLithuanianLumbeeLuxembourgerMacedonianMalaysianMalteseMarshalleseMenomineeMexicanMexican American IndianMongolianMoroccanNative HawaiianNavajoNepaleseNew ZealanderNicaraguanNigerianNorthern EuropeanNorwegianOkinawanOsageOttawaPaiutePakistaniPalestinianPanamanianParaguayanPennsylvania GermanPeruvianPimaPolishPortuguesePotawatomiPuebloPuerto RicanPuget Sound SalishRomanianRussianSalvadoranSamoanScandinavianScotch-IrishScottishSeminoleSenegaleseSerbianShoshoneSierra LeoneanSiouxSlavicSlovakSloveneSomaliSouth AfricanSouth AmericanSouth American IndianSoviet UnionSpaniardSpanishSpanish AmericanSpanish American IndianSri LankanSubsaharan AfricanSudaneseSwedishSwissSyrianTaiwaneseThaiTlingit-HaidaTohono O'OdhamTonganTrinidadian and TobagonianTsimshianTurkishU.S. Virgin IslanderUgandanUruguayanUteVenezuelanVietnameseWelshWest IndianYakamaYaquiYugoslavianYumanYup'ikZimbabwean
Immigration
NonimmigrantsImmigrantsAfghanistanAfricaAlbaniaArgentinaArmeniaAsiaAustraliaAustriaBahamasBangladeshBarbadosBelarusBelgiumBelizeBoliviaBosnia and HerzegovinaBrazilBulgariaBurma/MyanmarCabo VerdeCambodiaCameroonCanadaCaribbeanCentral AmericaChileChinaColombiaCongoCosta RicaCroatiaCubaCzechoslovakiaDenmarkDominicaDominican RepublicEastern AfricaEastern AsiaEastern EuropeEcuadorEgyptEl SalvadorEnglandEritreaEthiopiaEuropeFijiFranceGermanyGhanaGreeceGrenadaGuatemalaGuyanaHaitiHondurasHong KongHungaryIndiaIndonesiaIranIraqIrelandIsraelItalyJamaicaJapanJordanKazakhstanKenyaKoreaKuwaitLaosLatin AmericaLatviaLebanonLiberiaLithuaniaMalaysiaMexicoMicronesiaMiddle AfricaMoldovaMoroccoNepalNetherlandsNicaraguaNigeriaNorth AmericaNorth MacedoniaNorthern AfricaNorthern EuropeNorwayOceaniaPakistanPanamaPeruPhilippinesPolandPortugalRomaniaRussiaSaudi ArabiaScotlandSenegalSerbiaSierra LeoneSingaporeSomaliaSouth AfricaSouth AmericaSouth Central AsiaSouth Eastern AsiaSouthern EuropeSpainSri LankaSt. Vincent and the GrenadinesSudanSwedenSwitzerlandSyriaTaiwanThailandTrinidad and TobagoTurkeyUgandaUkraineUruguayUzbekistanVenezuelaVietnamWest IndiesWestern AfricaWestern AsiaWestern EuropeYemenZaireZimbabweAzores
2 or more Vehicles in Household
Income
Poverty
Unemployment
Labor Participation
Family Structure
Vehicle Availability
Education Level
Disability

Ukrainian 2 or more Vehicles in Household
Good

55.8%
2+ VEHICLES AVAILABLE
70.8/ 100
METRIC RATING
154th/ 347
METRIC RANK

Ukrainian 2 or more Vehicles in Household Correlation Chart

The statistical analysis conducted on geographies consisting of 448,366,334 people shows a slight positive correlation between the proportion of Ukrainians and percentage of households with 2 or more vehicles available in the United States with a correlation coefficient (R) of 0.074 and weighted average of 55.8%. On average, for every 1% (one percent) increase in Ukrainians within a typical geography, there is an increase of 0.085% in percentage of households with 2 or more vehicles available.
Ukrainian 2 or more Vehicles in Household
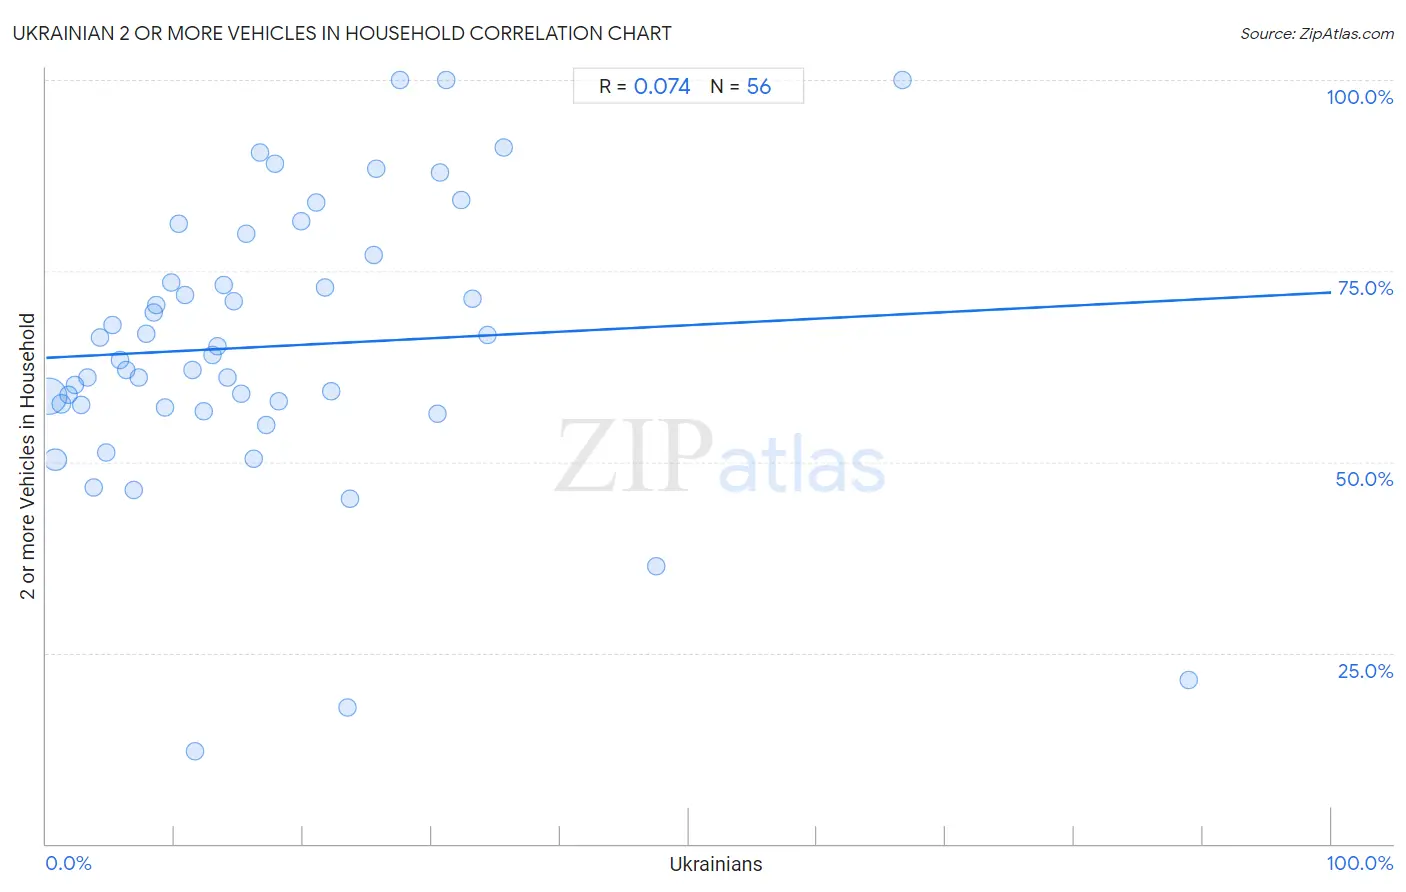
It is essential to understand that the correlation between the percentage of Ukrainians and percentage of households with 2 or more vehicles available does not imply a direct cause-and-effect relationship. It remains uncertain whether the presence of Ukrainians influences an upward or downward trend in the level of percentage of households with 2 or more vehicles available within an area, or if Ukrainians simply ended up residing in those areas with higher or lower levels of percentage of households with 2 or more vehicles available due to other factors.

Demographics Similar to Ukrainians by 2 or more Vehicles in Household

In terms of 2 or more vehicles in household, the demographic groups most similar to Ukrainians are Immigrants from Venezuela (55.8%, a difference of 0.0%), Immigrants from Lithuania (55.8%, a difference of 0.020%), Immigrants from Kuwait (55.8%, a difference of 0.030%), Lumbee (55.9%, a difference of 0.060%), and Tlingit-Haida (55.8%, a difference of 0.10%).
DemographicsRating | Rank2 or more Vehicles in Household
Serbians
80.3
/100
|
#147
Excellent
56.1%
Immigrants from Moldova
80.2
/100
|
#148
Excellent
56.1%
Chileans
80.2
/100
|
#149
Excellent
56.1%
Nicaraguans
79.9
/100
|
#150
Good
56.1%
Immigrants from Northern Europe
78.7
/100
|
#151
Good
56.1%
Immigrants from Pakistan
78.1
/100
|
#152
Good
56.1%
Lumbee
71.9
/100
|
#153
Good
55.9%
Ukrainians
70.8
/100
|
#154
Good
55.8%
Immigrants from Venezuela
70.7
/100
|
#155
Good
55.8%
Immigrants from Lithuania
70.4
/100
|
#156
Good
55.8%
Immigrants from Kuwait
70.2
/100
|
#157
Good
55.8%
Tlingit-Haida
68.5
/100
|
#158
Good
55.8%
Paiute
68.0
/100
|
#159
Good
55.8%
Crow
67.0
/100
|
#160
Good
55.7%
Colville
61.1
/100
|
#161
Good
55.6%

Ukrainian 2 or more Vehicles in Household Correlation Summary

MeasurementUkrainian Data2 or more Vehicles in Household Data
Minimum0.19%12.1%
Maximum88.9%100.0%
Range88.7%87.9%
Mean17.5%65.1%
Median13.9%63.7%
Interquartile 25% (IQ1)7.0%57.3%
Interquartile 75% (IQ3)23.5%75.2%
Interquartile Range (IQR)16.5%18.0%
Standard Deviation (Sample)15.9%18.5%
Standard Deviation (Population)15.8%18.3%

Correlation Details

Ukrainian PercentileSample Size2 or more Vehicles in Household
[
0.0%
-
0.5%
]
0.19%
334,573,59658.6%
[
0.5%
-
1.0%
]
0.70%
78,081,02350.3%
[
1.0%
-
1.5%
]
1.19%
19,130,48457.6%
[
1.5%
-
2.0%
]
1.73%
7,971,88958.8%
[
2.0%
-
2.5%
]
2.24%
2,920,58360.1%
[
2.5%
-
3.0%
]
2.70%
2,331,05057.4%
[
3.0%
-
3.5%
]
3.25%
708,22361.1%
[
3.5%
-
4.0%
]
3.73%
803,01746.6%
[
4.0%
-
4.5%
]
4.20%
383,23266.3%
[
4.5%
-
5.0%
]
4.68%
384,75851.2%
[
5.0%
-
5.5%
]
5.19%
142,40867.9%
[
5.5%
-
6.0%
]
5.76%
306,10763.4%
[
6.0%
-
6.5%
]
6.20%
146,82262.1%
[
6.5%
-
7.0%
]
6.82%
105,36046.4%
[
7.0%
-
7.5%
]
7.17%
75,10761.0%
[
7.5%
-
8.0%
]
7.81%
8,71166.7%
[
8.0%
-
8.5%
]
8.37%
88,11769.5%
[
8.5%
-
9.0%
]
8.56%
56,96370.6%
[
9.0%
-
9.5%
]
9.23%
12,60357.1%
[
9.5%
-
10.0%
]
9.71%
11,56473.4%
[
10.0%
-
10.5%
]
10.30%
7,03081.2%
[
10.5%
-
11.0%
]
10.84%
3,25671.8%
[
11.0%
-
11.5%
]
11.36%
54662.1%
[
11.5%
-
12.0%
]
11.61%
85,95912.1%
[
12.0%
-
12.5%
]
12.22%
2,62656.6%
[
12.5%
-
13.0%
]
12.89%
2,07964.1%
[
13.0%
-
13.5%
]
13.37%
3,58965.2%
[
13.5%
-
14.0%
]
13.78%
31273.1%
[
14.0%
-
14.5%
]
14.07%
2,09761.1%
[
14.5%
-
15.0%
]
14.58%
1,36571.1%
[
15.0%
-
15.5%
]
15.15%
1,09658.9%
[
15.5%
-
16.0%
]
15.58%
1,34879.8%
[
16.0%
-
16.5%
]
16.17%
3,03150.5%
[
16.5%
-
17.0%
]
16.60%
47690.5%
[
17.0%
-
17.5%
]
17.10%
69054.8%
[
17.5%
-
18.0%
]
17.78%
47889.0%
[
18.0%
-
18.5%
]
18.08%
1,02357.9%
[
19.5%
-
20.0%
]
19.85%
1,35581.5%
[
20.5%
-
21.0%
]
21.00%
58183.9%
[
21.5%
-
22.0%
]
21.69%
16672.8%
[
22.0%
-
22.5%
]
22.16%
38859.2%
[
23.0%
-
23.5%
]
23.42%
22217.8%
[
23.5%
-
24.0%
]
23.67%
30045.2%
[
25.0%
-
25.5%
]
25.46%
49177.0%
[
25.5%
-
26.0%
]
25.65%
38288.4%
[
27.0%
-
27.5%
]
27.50%
40100.0%
[
30.0%
-
30.5%
]
30.43%
4656.2%
[
30.5%
-
31.0%
]
30.60%
97487.9%
[
31.0%
-
31.5%
]
31.13%
257100.0%
[
32.0%
-
32.5%
]
32.26%
15584.3%
[
33.0%
-
33.5%
]
33.14%
1,53671.4%
[
34.0%
-
34.5%
]
34.38%
6466.7%
[
35.5%
-
36.0%
]
35.59%
28191.1%
[
47.0%
-
47.5%
]
47.43%
40936.3%
[
66.5%
-
67.0%
]
66.67%
42100.0%
[
88.5%
-
89.0%
]
88.89%
2721.4%