Ukrainian Receiving Food Stamps

COMPARE

Ukrainian
Race
Ancestry
AfghanAfricanAlaska NativeAlaskan AthabascanAlbanianAleutAlsatianAmericanApacheArabArapahoArgentineanArmenianAssyrian/Chaldean/SyriacAustralianAustrianBahamianBangladeshiBarbadianBasqueBelgianBelizeanBermudanBhutaneseBlackfeetBolivianBrazilianBritishBritish West IndianBulgarianBurmeseCajunCambodianCanadianCape VerdeanCarpatho RusynCelticCentral AmericanCentral American IndianCherokeeCheyenneChickasawChileanChineseChippewaChoctawColombianColvilleComancheCosta RicanCreeCreekCroatianCrowCubanCypriotCzechCzechoslovakianDanishDelawareDominicanDutchDutch West IndianEastern EuropeanEcuadorianEgyptianEnglishEstonianEthiopianEuropeanFijianFilipinoFinnishFrenchFrench American IndianFrench CanadianGermanGerman RussianGhanaianGreekGuamanian/ChamorroGuatemalanGuyaneseHaitianHmongHonduranHopiHoumaHungarianIcelanderIndian (Asian)IndonesianInupiatIranianIraqiIrishIroquoisIsraeliItalianJamaicanJapaneseJordanianKenyanKiowaKoreanLaotianLatvianLebaneseLiberianLithuanianLumbeeLuxembourgerMacedonianMalaysianMalteseMarshalleseMenomineeMexicanMexican American IndianMongolianMoroccanNative HawaiianNavajoNepaleseNew ZealanderNicaraguanNigerianNorthern EuropeanNorwegianOkinawanOsageOttawaPaiutePakistaniPalestinianPanamanianParaguayanPennsylvania GermanPeruvianPimaPolishPortuguesePotawatomiPuebloPuerto RicanPuget Sound SalishRomanianRussianSalvadoranSamoanScandinavianScotch-IrishScottishSeminoleSenegaleseSerbianShoshoneSierra LeoneanSiouxSlavicSlovakSloveneSomaliSouth AfricanSouth AmericanSouth American IndianSoviet UnionSpaniardSpanishSpanish AmericanSpanish American IndianSri LankanSubsaharan AfricanSudaneseSwedishSwissSyrianTaiwaneseThaiTlingit-HaidaTohono O'OdhamTonganTrinidadian and TobagonianTsimshianTurkishU.S. Virgin IslanderUgandanUkrainianUruguayanUteVenezuelanVietnameseWelshWest IndianYakamaYaquiYugoslavianYumanYup'ikZimbabwean
Immigration
NonimmigrantsImmigrantsAfghanistanAfricaAlbaniaArgentinaArmeniaAsiaAustraliaAustriaBahamasBangladeshBarbadosBelarusBelgiumBelizeBoliviaBosnia and HerzegovinaBrazilBulgariaBurma/MyanmarCabo VerdeCambodiaCameroonCanadaCaribbeanCentral AmericaChileChinaColombiaCongoCosta RicaCroatiaCubaCzechoslovakiaDenmarkDominicaDominican RepublicEastern AfricaEastern AsiaEastern EuropeEcuadorEgyptEl SalvadorEnglandEritreaEthiopiaEuropeFijiFranceGermanyGhanaGreeceGrenadaGuatemalaGuyanaHaitiHondurasHong KongHungaryIndiaIndonesiaIranIraqIrelandIsraelItalyJamaicaJapanJordanKazakhstanKenyaKoreaKuwaitLaosLatin AmericaLatviaLebanonLiberiaLithuaniaMalaysiaMexicoMicronesiaMiddle AfricaMoldovaMoroccoNepalNetherlandsNicaraguaNigeriaNorth AmericaNorth MacedoniaNorthern AfricaNorthern EuropeNorwayOceaniaPakistanPanamaPeruPhilippinesPolandPortugalRomaniaRussiaSaudi ArabiaScotlandSenegalSerbiaSierra LeoneSingaporeSomaliaSouth AfricaSouth AmericaSouth Central AsiaSouth Eastern AsiaSouthern EuropeSpainSri LankaSt. Vincent and the GrenadinesSudanSwedenSwitzerlandSyriaTaiwanThailandTrinidad and TobagoTurkeyUgandaUkraineUruguayUzbekistanVenezuelaVietnamWest IndiesWestern AfricaWestern AsiaWestern EuropeYemenZaireZimbabweAzores
Select to Compare
Race
Ancestry
AfghanAfricanAlaska NativeAlaskan AthabascanAlbanianAleutAlsatianAmericanApacheArabArapahoArgentineanArmenianAssyrian/Chaldean/SyriacAustralianAustrianBahamianBangladeshiBarbadianBasqueBelgianBelizeanBermudanBhutaneseBlackfeetBolivianBrazilianBritishBritish West IndianBulgarianBurmeseCajunCambodianCanadianCape VerdeanCarpatho RusynCelticCentral AmericanCentral American IndianCherokeeCheyenneChickasawChileanChineseChippewaChoctawColombianColvilleComancheCosta RicanCreeCreekCroatianCrowCubanCypriotCzechCzechoslovakianDanishDelawareDominicanDutchDutch West IndianEastern EuropeanEcuadorianEgyptianEnglishEstonianEthiopianEuropeanFijianFilipinoFinnishFrenchFrench American IndianFrench CanadianGermanGerman RussianGhanaianGreekGuamanian/ChamorroGuatemalanGuyaneseHaitianHmongHonduranHopiHoumaHungarianIcelanderIndian (Asian)IndonesianInupiatIranianIraqiIrishIroquoisIsraeliItalianJamaicanJapaneseJordanianKenyanKiowaKoreanLaotianLatvianLebaneseLiberianLithuanianLumbeeLuxembourgerMacedonianMalaysianMalteseMarshalleseMenomineeMexicanMexican American IndianMongolianMoroccanNative HawaiianNavajoNepaleseNew ZealanderNicaraguanNigerianNorthern EuropeanNorwegianOkinawanOsageOttawaPaiutePakistaniPalestinianPanamanianParaguayanPennsylvania GermanPeruvianPimaPolishPortuguesePotawatomiPuebloPuerto RicanPuget Sound SalishRomanianRussianSalvadoranSamoanScandinavianScotch-IrishScottishSeminoleSenegaleseSerbianShoshoneSierra LeoneanSiouxSlavicSlovakSloveneSomaliSouth AfricanSouth AmericanSouth American IndianSoviet UnionSpaniardSpanishSpanish AmericanSpanish American IndianSri LankanSubsaharan AfricanSudaneseSwedishSwissSyrianTaiwaneseThaiTlingit-HaidaTohono O'OdhamTonganTrinidadian and TobagonianTsimshianTurkishU.S. Virgin IslanderUgandanUruguayanUteVenezuelanVietnameseWelshWest IndianYakamaYaquiYugoslavianYumanYup'ikZimbabwean
Immigration
NonimmigrantsImmigrantsAfghanistanAfricaAlbaniaArgentinaArmeniaAsiaAustraliaAustriaBahamasBangladeshBarbadosBelarusBelgiumBelizeBoliviaBosnia and HerzegovinaBrazilBulgariaBurma/MyanmarCabo VerdeCambodiaCameroonCanadaCaribbeanCentral AmericaChileChinaColombiaCongoCosta RicaCroatiaCubaCzechoslovakiaDenmarkDominicaDominican RepublicEastern AfricaEastern AsiaEastern EuropeEcuadorEgyptEl SalvadorEnglandEritreaEthiopiaEuropeFijiFranceGermanyGhanaGreeceGrenadaGuatemalaGuyanaHaitiHondurasHong KongHungaryIndiaIndonesiaIranIraqIrelandIsraelItalyJamaicaJapanJordanKazakhstanKenyaKoreaKuwaitLaosLatin AmericaLatviaLebanonLiberiaLithuaniaMalaysiaMexicoMicronesiaMiddle AfricaMoldovaMoroccoNepalNetherlandsNicaraguaNigeriaNorth AmericaNorth MacedoniaNorthern AfricaNorthern EuropeNorwayOceaniaPakistanPanamaPeruPhilippinesPolandPortugalRomaniaRussiaSaudi ArabiaScotlandSenegalSerbiaSierra LeoneSingaporeSomaliaSouth AfricaSouth AmericaSouth Central AsiaSouth Eastern AsiaSouthern EuropeSpainSri LankaSt. Vincent and the GrenadinesSudanSwedenSwitzerlandSyriaTaiwanThailandTrinidad and TobagoTurkeyUgandaUkraineUruguayUzbekistanVenezuelaVietnamWest IndiesWestern AfricaWestern AsiaWestern EuropeYemenZaireZimbabweAzores
Receiving Food Stamps
Income
Poverty
Unemployment
Labor Participation
Family Structure
Vehicle Availability
Education Level
Disability

Ukrainian Receiving Food Stamps
Exceptional

10.7%
PUBLIC INCOME | FOOD STAMPS
92.8/ 100
METRIC RATING
125th/ 347
METRIC RANK

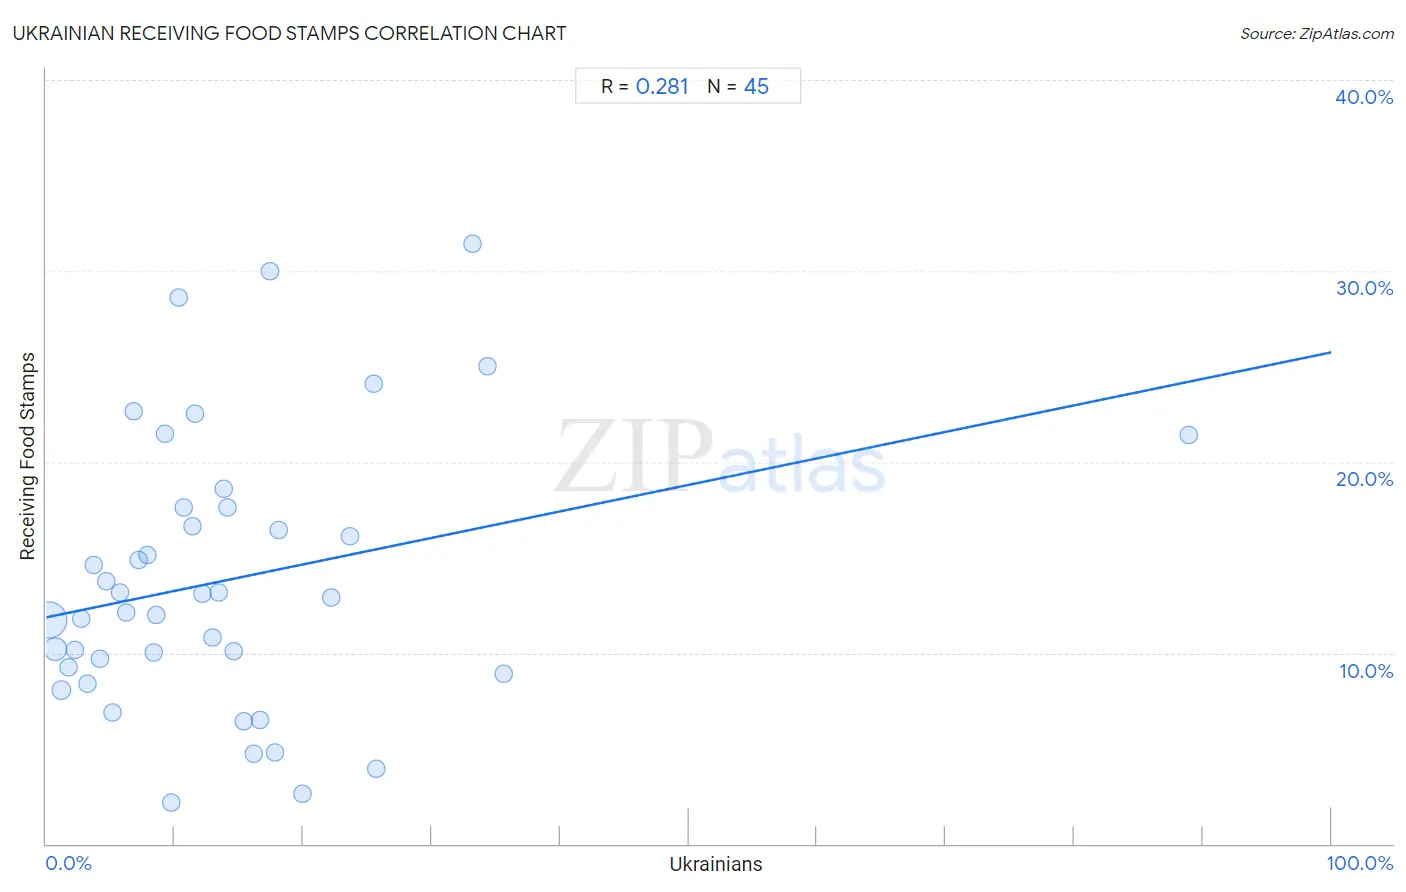
Ukrainian Receiving Food Stamps Correlation Chart

The statistical analysis conducted on geographies consisting of 446,698,420 people shows a weak positive correlation between the proportion of Ukrainians and percentage of population receiving government assistance and/or food stamps in the United States with a correlation coefficient (R) of 0.281 and weighted average of 10.7%. On average, for every 1% (one percent) increase in Ukrainians within a typical geography, there is an increase of 0.14% in percentage of population receiving government assistance and/or food stamps.
Ukrainian Receiving Food Stamps
It is essential to understand that the correlation between the percentage of Ukrainians and percentage of population receiving government assistance and/or food stamps does not imply a direct cause-and-effect relationship. It remains uncertain whether the presence of Ukrainians influences an upward or downward trend in the level of percentage of population receiving government assistance and/or food stamps within an area, or if Ukrainians simply ended up residing in those areas with higher or lower levels of percentage of population receiving government assistance and/or food stamps due to other factors.

Demographics Similar to Ukrainians by Receiving Food Stamps

In terms of receiving food stamps, the demographic groups most similar to Ukrainians are Paraguayan (10.7%, a difference of 0.080%), Afghan (10.7%, a difference of 0.14%), Immigrants from Ethiopia (10.7%, a difference of 0.16%), Immigrants from Jordan (10.7%, a difference of 0.17%), and Yugoslavian (10.7%, a difference of 0.17%).
DemographicsRating | RankReceiving Food Stamps
Assyrians/Chaldeans/Syriacs
94.1
/100
|
#118
Exceptional
10.6%
Immigrants from Poland
93.9
/100
|
#119
Exceptional
10.6%
Ethiopians
93.9
/100
|
#120
Exceptional
10.6%
Slavs
93.8
/100
|
#121
Exceptional
10.6%
Sri Lankans
93.7
/100
|
#122
Exceptional
10.6%
Immigrants from Philippines
93.3
/100
|
#123
Exceptional
10.7%
Paraguayans
93.0
/100
|
#124
Exceptional
10.7%
Ukrainians
92.8
/100
|
#125
Exceptional
10.7%
Afghans
92.6
/100
|
#126
Exceptional
10.7%
Immigrants from Ethiopia
92.6
/100
|
#127
Exceptional
10.7%
Immigrants from Jordan
92.5
/100
|
#128
Exceptional
10.7%
Yugoslavians
92.5
/100
|
#129
Exceptional
10.7%
Israelis
92.4
/100
|
#130
Exceptional
10.7%
French
92.3
/100
|
#131
Exceptional
10.7%
Immigrants from Germany
92.0
/100
|
#132
Exceptional
10.7%

Ukrainian Receiving Food Stamps Correlation Summary

MeasurementUkrainian DataReceiving Food Stamps Data
Minimum0.19%2.2%
Maximum88.9%31.4%
Range88.7%29.2%
Mean14.1%13.8%
Median11.4%12.9%
Interquartile 25% (IQ1)5.5%9.1%
Interquartile 75% (IQ3)17.6%17.6%
Interquartile Range (IQR)12.1%8.5%
Standard Deviation (Sample)14.5%7.2%
Standard Deviation (Population)14.3%7.1%

Correlation Details

Ukrainian PercentileSample SizeReceiving Food Stamps
[
0.0%
-
0.5%
]
0.19%
333,929,00211.7%
[
0.5%
-
1.0%
]
0.70%
77,605,74110.2%
[
1.0%
-
1.5%
]
1.19%
18,953,1448.1%
[
1.5%
-
2.0%
]
1.73%
7,877,8759.2%
[
2.0%
-
2.5%
]
2.24%
2,859,85010.2%
[
2.5%
-
3.0%
]
2.70%
2,223,13911.8%
[
3.0%
-
3.5%
]
3.24%
679,2828.4%
[
3.5%
-
4.0%
]
3.73%
784,49214.6%
[
4.0%
-
4.5%
]
4.19%
362,1589.7%
[
4.5%
-
5.0%
]
4.68%
381,51413.8%
[
5.0%
-
5.5%
]
5.20%
137,6556.9%
[
5.5%
-
6.0%
]
5.76%
305,36513.1%
[
6.0%
-
6.5%
]
6.20%
143,55312.1%
[
6.5%
-
7.0%
]
6.82%
104,22222.7%
[
7.0%
-
7.5%
]
7.17%
73,96214.9%
[
7.5%
-
8.0%
]
7.84%
6,34115.1%
[
8.0%
-
8.5%
]
8.38%
82,96410.0%
[
8.5%
-
9.0%
]
8.52%
49,27712.0%
[
9.0%
-
9.5%
]
9.23%
12,60321.5%
[
9.5%
-
10.0%
]
9.71%
11,5642.2%
[
10.0%
-
10.5%
]
10.35%
4,35828.6%
[
10.5%
-
11.0%
]
10.74%
4,62817.6%
[
11.0%
-
11.5%
]
11.42%
39416.6%
[
11.5%
-
12.0%
]
11.61%
85,46822.5%
[
12.0%
-
12.5%
]
12.20%
2,25413.1%
[
12.5%
-
13.0%
]
12.89%
2,07910.8%
[
13.0%
-
13.5%
]
13.38%
3,56613.1%
[
13.5%
-
14.0%
]
13.78%
31218.6%
[
14.0%
-
14.5%
]
14.06%
2,02717.6%
[
14.5%
-
15.0%
]
14.56%
1,19510.1%
[
15.0%
-
15.5%
]
15.32%
3856.4%
[
16.0%
-
16.5%
]
16.19%
2,3904.7%
[
16.5%
-
17.0%
]
16.62%
3436.5%
[
17.0%
-
17.5%
]
17.39%
9230.0%
[
17.5%
-
18.0%
]
17.85%
2974.8%
[
18.0%
-
18.5%
]
18.08%
96816.4%
[
19.5%
-
20.0%
]
19.92%
4922.6%
[
22.0%
-
22.5%
]
22.16%
38812.9%
[
23.5%
-
24.0%
]
23.67%
30016.1%
[
25.0%
-
25.5%
]
25.46%
49124.1%
[
25.5%
-
26.0%
]
25.65%
3823.9%
[
33.0%
-
33.5%
]
33.14%
1,53631.4%
[
34.0%
-
34.5%
]
34.38%
6425.0%
[
35.5%
-
36.0%
]
35.59%
2818.9%
[
88.5%
-
89.0%
]
88.89%
2721.4%