Ukrainian 4 or more Vehicles in Household
COMPARE
Ukrainian
Select to Compare
4 or more Vehicles in Household
Ukrainian 4 or more Vehicles in Household
6.3%
4+ VEHICLES AVAILABLE
47.6/ 100
METRIC RATING
176th/ 347
METRIC RANK
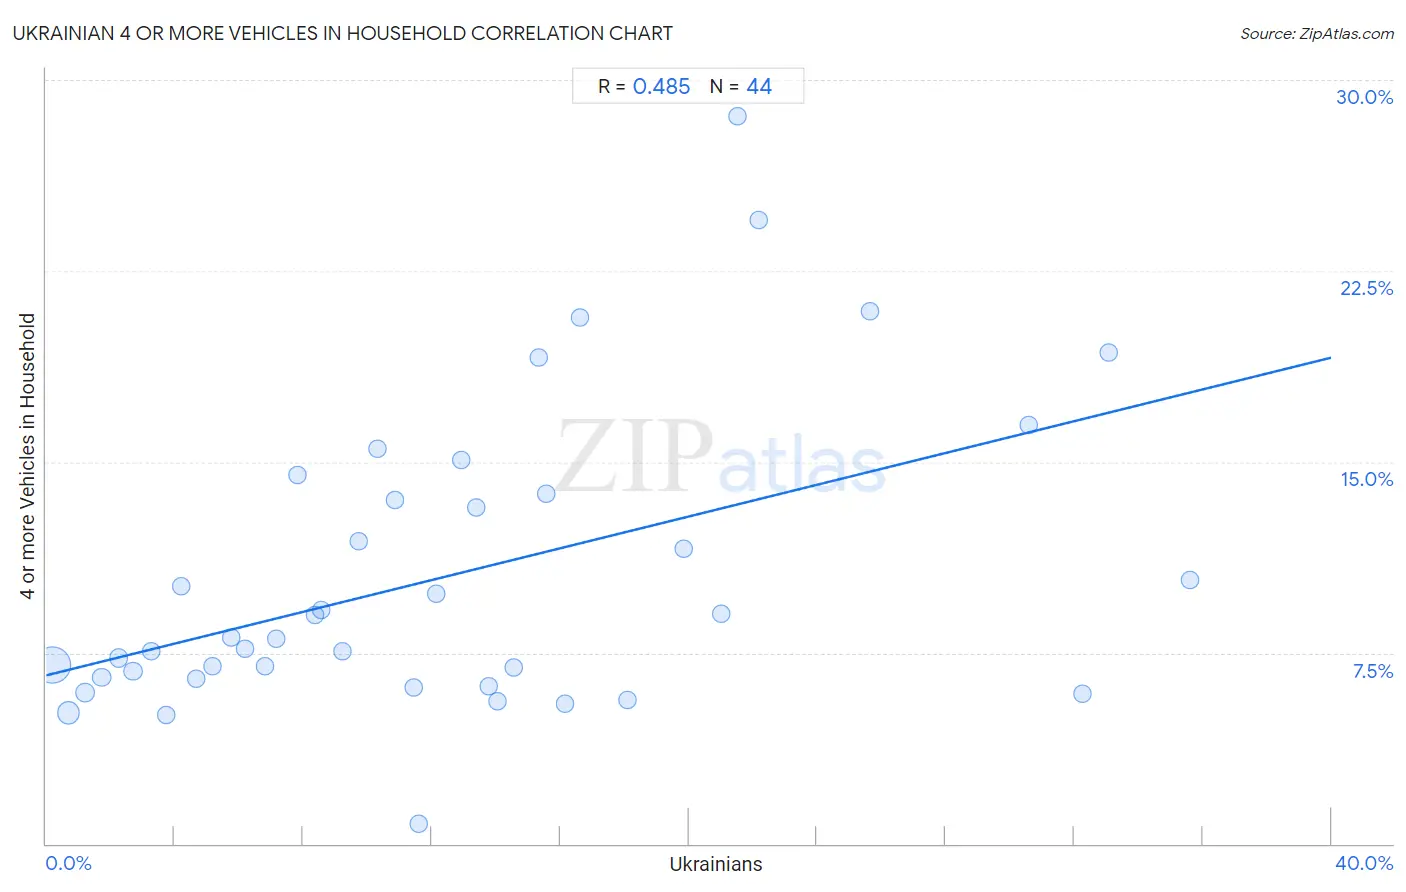
Ukrainian 4 or more Vehicles in Household Correlation Chart
The statistical analysis conducted on geographies consisting of 446,444,897 people shows a moderate positive correlation between the proportion of Ukrainians and percentage of households with 4 or more vehicles available in the United States with a correlation coefficient (R) of 0.485 and weighted average of 6.3%. On average, for every 1% (one percent) increase in Ukrainians within a typical geography, there is an increase of 0.31% in percentage of households with 4 or more vehicles available.
It is essential to understand that the correlation between the percentage of Ukrainians and percentage of households with 4 or more vehicles available does not imply a direct cause-and-effect relationship. It remains uncertain whether the presence of Ukrainians influences an upward or downward trend in the level of percentage of households with 4 or more vehicles available within an area, or if Ukrainians simply ended up residing in those areas with higher or lower levels of percentage of households with 4 or more vehicles available due to other factors.
Demographics Similar to Ukrainians by 4 or more Vehicles in Household
In terms of 4 or more vehicles in household, the demographic groups most similar to Ukrainians are Slovak (6.3%, a difference of 0.070%), Immigrants from Western Europe (6.3%, a difference of 0.12%), Lithuanian (6.3%, a difference of 0.24%), Belizean (6.3%, a difference of 0.31%), and Slovene (6.3%, a difference of 0.36%).
| Demographics | Rating | Rank | 4 or more Vehicles in Household |
| Estonians | 55.1 /100 | #169 | Average 6.4% |
| Immigrants from Syria | 52.8 /100 | #170 | Average 6.3% |
| Immigrants from India | 51.9 /100 | #171 | Average 6.3% |
| Immigrants from Lebanon | 51.7 /100 | #172 | Average 6.3% |
| Slovenes | 51.1 /100 | #173 | Average 6.3% |
| Lithuanians | 50.0 /100 | #174 | Average 6.3% |
| Immigrants from Western Europe | 48.8 /100 | #175 | Average 6.3% |
| Ukrainians | 47.6 /100 | #176 | Average 6.3% |
| Slovaks | 46.9 /100 | #177 | Average 6.3% |
| Belizeans | 44.5 /100 | #178 | Average 6.3% |
| Immigrants from Japan | 43.1 /100 | #179 | Average 6.3% |
| Syrians | 42.0 /100 | #180 | Average 6.3% |
| Yugoslavians | 41.1 /100 | #181 | Average 6.3% |
| South American Indians | 40.7 /100 | #182 | Average 6.3% |
| Immigrants from Burma/Myanmar | 37.5 /100 | #183 | Fair 6.2% |
Ukrainian 4 or more Vehicles in Household Correlation Summary
| Measurement | Ukrainian Data | 4 or more Vehicles in Household Data |
| Minimum | 0.19% | 0.81% |
| Maximum | 35.6% | 28.6% |
| Range | 35.4% | 27.8% |
| Mean | 12.5% | 10.5% |
| Median | 11.1% | 8.1% |
| Interquartile 25% (IQ1) | 5.5% | 6.5% |
| Interquartile 75% (IQ3) | 16.4% | 13.6% |
| Interquartile Range (IQR) | 10.9% | 7.1% |
| Standard Deviation (Sample) | 9.1% | 5.8% |
| Standard Deviation (Population) | 9.0% | 5.8% |
Correlation Details
| Ukrainian Percentile | Sample Size | 4 or more Vehicles in Household |
[ 0.0% - 0.5% ] 0.19% | 333,515,888 | 7.0% |
[ 0.5% - 1.0% ] 0.70% | 77,708,983 | 5.1% |
[ 1.0% - 1.5% ] 1.19% | 18,893,766 | 5.9% |
[ 1.5% - 2.0% ] 1.73% | 7,854,370 | 6.6% |
[ 2.0% - 2.5% ] 2.24% | 2,896,100 | 7.3% |
[ 2.5% - 3.0% ] 2.70% | 2,287,381 | 6.8% |
[ 3.0% - 3.5% ] 3.25% | 690,287 | 7.6% |
[ 3.5% - 4.0% ] 3.73% | 787,217 | 5.1% |
[ 4.0% - 4.5% ] 4.20% | 377,452 | 10.1% |
[ 4.5% - 5.0% ] 4.68% | 380,290 | 6.5% |
[ 5.0% - 5.5% ] 5.19% | 136,382 | 7.0% |
[ 5.5% - 6.0% ] 5.76% | 303,529 | 8.1% |
[ 6.0% - 6.5% ] 6.20% | 145,623 | 7.7% |
[ 6.5% - 7.0% ] 6.82% | 104,755 | 7.0% |
[ 7.0% - 7.5% ] 7.17% | 72,888 | 8.0% |
[ 7.5% - 8.0% ] 7.82% | 7,406 | 14.5% |
[ 8.0% - 8.5% ] 8.36% | 86,803 | 9.0% |
[ 8.5% - 9.0% ] 8.56% | 55,995 | 9.2% |
[ 9.0% - 9.5% ] 9.23% | 12,603 | 7.5% |
[ 9.5% - 10.0% ] 9.71% | 11,441 | 11.9% |
[ 10.0% - 10.5% ] 10.29% | 6,820 | 15.5% |
[ 10.5% - 11.0% ] 10.86% | 2,818 | 13.5% |
[ 11.0% - 11.5% ] 11.44% | 376 | 6.1% |
[ 11.5% - 12.0% ] 11.60% | 85,086 | 0.81% |
[ 12.0% - 12.5% ] 12.12% | 1,823 | 9.8% |
[ 12.5% - 13.0% ] 12.92% | 1,888 | 15.1% |
[ 13.0% - 13.5% ] 13.37% | 3,589 | 13.2% |
[ 13.5% - 14.0% ] 13.78% | 312 | 6.2% |
[ 14.0% - 14.5% ] 14.06% | 2,027 | 5.6% |
[ 14.5% - 15.0% ] 14.56% | 1,195 | 6.9% |
[ 15.0% - 15.5% ] 15.32% | 385 | 19.1% |
[ 15.5% - 16.0% ] 15.56% | 900 | 13.7% |
[ 16.0% - 16.5% ] 16.15% | 1,895 | 5.5% |
[ 16.5% - 17.0% ] 16.60% | 476 | 20.7% |
[ 18.0% - 18.5% ] 18.08% | 1,001 | 5.6% |
[ 19.5% - 20.0% ] 19.85% | 1,355 | 11.6% |
[ 20.5% - 21.0% ] 21.00% | 581 | 9.0% |
[ 21.5% - 22.0% ] 21.52% | 79 | 28.6% |
[ 22.0% - 22.5% ] 22.16% | 388 | 24.5% |
[ 25.5% - 26.0% ] 25.65% | 382 | 20.9% |
[ 30.5% - 31.0% ] 30.60% | 974 | 16.4% |
[ 32.0% - 32.5% ] 32.26% | 155 | 5.9% |
[ 33.0% - 33.5% ] 33.09% | 952 | 19.3% |
[ 35.5% - 36.0% ] 35.59% | 281 | 10.4% |