Ukrainian College, 1 year or more
COMPARE
Ukrainian
Select to Compare
College, 1 year or more
Ukrainian College, 1 year or more
61.8%
COLLEGE, 1 YEAR OR MORE
95.2/ 100
METRIC RATING
113th/ 347
METRIC RANK
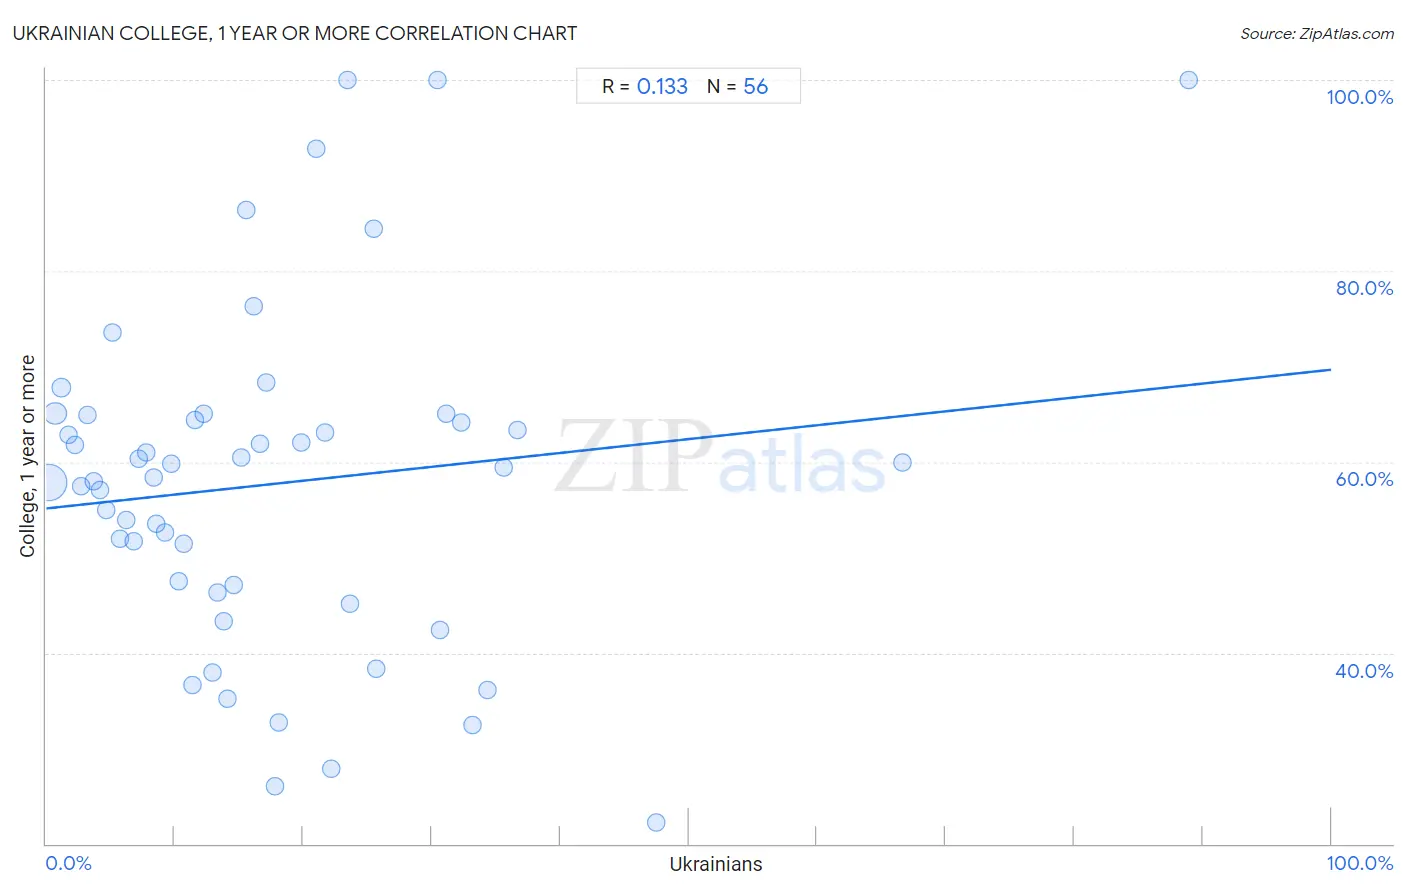
Ukrainian College, 1 year or more Correlation Chart
The statistical analysis conducted on geographies consisting of 448,693,874 people shows a poor positive correlation between the proportion of Ukrainians and percentage of population with at least college, 1 year or more education in the United States with a correlation coefficient (R) of 0.133 and weighted average of 61.8%. On average, for every 1% (one percent) increase in Ukrainians within a typical geography, there is an increase of 0.15% in percentage of population with at least college, 1 year or more education.
It is essential to understand that the correlation between the percentage of Ukrainians and percentage of population with at least college, 1 year or more education does not imply a direct cause-and-effect relationship. It remains uncertain whether the presence of Ukrainians influences an upward or downward trend in the level of percentage of population with at least college, 1 year or more education within an area, or if Ukrainians simply ended up residing in those areas with higher or lower levels of percentage of population with at least college, 1 year or more education due to other factors.
Demographics Similar to Ukrainians by College, 1 year or more
In terms of college, 1 year or more, the demographic groups most similar to Ukrainians are Austrian (61.8%, a difference of 0.070%), Danish (61.7%, a difference of 0.11%), European (61.8%, a difference of 0.13%), Macedonian (61.8%, a difference of 0.13%), and Immigrants from Northern Africa (61.9%, a difference of 0.14%).
| Demographics | Rating | Rank | College, 1 year or more |
| Palestinians | 96.3 /100 | #106 | Exceptional 62.0% |
| Immigrants from Ukraine | 95.8 /100 | #107 | Exceptional 61.9% |
| Syrians | 95.7 /100 | #108 | Exceptional 61.9% |
| Immigrants from Northern Africa | 95.7 /100 | #109 | Exceptional 61.9% |
| Europeans | 95.6 /100 | #110 | Exceptional 61.8% |
| Macedonians | 95.6 /100 | #111 | Exceptional 61.8% |
| Austrians | 95.4 /100 | #112 | Exceptional 61.8% |
| Ukrainians | 95.2 /100 | #113 | Exceptional 61.8% |
| Danes | 94.8 /100 | #114 | Exceptional 61.7% |
| Norwegians | 94.5 /100 | #115 | Exceptional 61.7% |
| Lebanese | 94.1 /100 | #116 | Exceptional 61.6% |
| Arabs | 93.9 /100 | #117 | Exceptional 61.6% |
| Immigrants from Brazil | 93.9 /100 | #118 | Exceptional 61.6% |
| Assyrians/Chaldeans/Syriacs | 93.3 /100 | #119 | Exceptional 61.5% |
| Pakistanis | 93.2 /100 | #120 | Exceptional 61.5% |
Ukrainian College, 1 year or more Correlation Summary
| Measurement | Ukrainian Data | College, 1 year or more Data |
| Minimum | 0.19% | 22.2% |
| Maximum | 88.9% | 100.0% |
| Range | 88.7% | 77.8% |
| Mean | 17.7% | 57.7% |
| Median | 13.9% | 58.9% |
| Interquartile 25% (IQ1) | 7.0% | 46.7% |
| Interquartile 75% (IQ3) | 23.5% | 64.7% |
| Interquartile Range (IQR) | 16.5% | 17.9% |
| Standard Deviation (Sample) | 16.1% | 17.6% |
| Standard Deviation (Population) | 15.9% | 17.5% |
Correlation Details
| Ukrainian Percentile | Sample Size | College, 1 year or more |
[ 0.0% - 0.5% ] 0.19% | 334,802,098 | 57.9% |
[ 0.5% - 1.0% ] 0.70% | 78,132,254 | 65.1% |
[ 1.0% - 1.5% ] 1.19% | 19,147,702 | 67.8% |
[ 1.5% - 2.0% ] 1.73% | 7,984,710 | 62.8% |
[ 2.0% - 2.5% ] 2.24% | 2,931,109 | 61.8% |
[ 2.5% - 3.0% ] 2.70% | 2,332,779 | 57.5% |
[ 3.0% - 3.5% ] 3.25% | 709,981 | 64.9% |
[ 3.5% - 4.0% ] 3.73% | 803,017 | 57.9% |
[ 4.0% - 4.5% ] 4.20% | 384,575 | 57.1% |
[ 4.5% - 5.0% ] 4.68% | 385,371 | 54.9% |
[ 5.0% - 5.5% ] 5.19% | 142,408 | 73.5% |
[ 5.5% - 6.0% ] 5.76% | 306,107 | 52.0% |
[ 6.0% - 6.5% ] 6.20% | 146,822 | 54.0% |
[ 6.5% - 7.0% ] 6.82% | 105,360 | 51.7% |
[ 7.0% - 7.5% ] 7.17% | 75,107 | 60.3% |
[ 7.5% - 8.0% ] 7.81% | 8,698 | 61.0% |
[ 8.0% - 8.5% ] 8.37% | 88,117 | 58.4% |
[ 8.5% - 9.0% ] 8.56% | 56,963 | 53.5% |
[ 9.0% - 9.5% ] 9.23% | 12,603 | 52.6% |
[ 9.5% - 10.0% ] 9.71% | 11,564 | 59.7% |
[ 10.0% - 10.5% ] 10.30% | 7,030 | 47.5% |
[ 10.5% - 11.0% ] 10.73% | 5,078 | 51.4% |
[ 11.0% - 11.5% ] 11.36% | 546 | 36.7% |
[ 11.5% - 12.0% ] 11.61% | 85,959 | 64.4% |
[ 12.0% - 12.5% ] 12.22% | 2,626 | 65.1% |
[ 12.5% - 13.0% ] 12.89% | 2,079 | 37.9% |
[ 13.0% - 13.5% ] 13.37% | 3,589 | 46.3% |
[ 13.5% - 14.0% ] 13.78% | 312 | 43.3% |
[ 14.0% - 14.5% ] 14.07% | 2,097 | 35.2% |
[ 14.5% - 15.0% ] 14.58% | 1,365 | 47.1% |
[ 15.0% - 15.5% ] 15.15% | 1,096 | 60.5% |
[ 15.5% - 16.0% ] 15.58% | 1,348 | 86.3% |
[ 16.0% - 16.5% ] 16.17% | 3,031 | 76.3% |
[ 16.5% - 17.0% ] 16.60% | 476 | 61.9% |
[ 17.0% - 17.5% ] 17.10% | 690 | 68.3% |
[ 17.5% - 18.0% ] 17.78% | 478 | 26.0% |
[ 18.0% - 18.5% ] 18.08% | 1,023 | 32.7% |
[ 19.5% - 20.0% ] 19.85% | 1,355 | 62.0% |
[ 20.5% - 21.0% ] 21.00% | 581 | 92.7% |
[ 21.5% - 22.0% ] 21.69% | 166 | 63.1% |
[ 22.0% - 22.5% ] 22.16% | 388 | 27.9% |
[ 23.0% - 23.5% ] 23.42% | 222 | 100.0% |
[ 23.5% - 24.0% ] 23.67% | 300 | 45.2% |
[ 25.0% - 25.5% ] 25.46% | 491 | 84.4% |
[ 25.5% - 26.0% ] 25.65% | 382 | 38.4% |
[ 30.0% - 30.5% ] 30.43% | 46 | 100.0% |
[ 30.5% - 31.0% ] 30.60% | 974 | 42.4% |
[ 31.0% - 31.5% ] 31.13% | 257 | 65.0% |
[ 32.0% - 32.5% ] 32.26% | 155 | 64.1% |
[ 33.0% - 33.5% ] 33.14% | 1,536 | 32.5% |
[ 34.0% - 34.5% ] 34.38% | 64 | 36.2% |
[ 35.5% - 36.0% ] 35.59% | 281 | 59.4% |
[ 36.5% - 37.0% ] 36.67% | 30 | 63.3% |
[ 47.0% - 47.5% ] 47.43% | 409 | 22.2% |
[ 66.5% - 67.0% ] 66.67% | 42 | 60.0% |
[ 88.5% - 89.0% ] 88.89% | 27 | 100.0% |