Ukrainian Unemployment Among Women with Children Ages 6 to 17 years
COMPARE
Ukrainian
Select to Compare
Unemployment Among Women with Children Ages 6 to 17 years
Ukrainian Unemployment Among Women with Children Ages 6 to 17 years
8.9%
UNEMPLOYMENT | WOMEN W/ CHILDREN 6 TO 17
59.7/ 100
METRIC RATING
164th/ 347
METRIC RANK
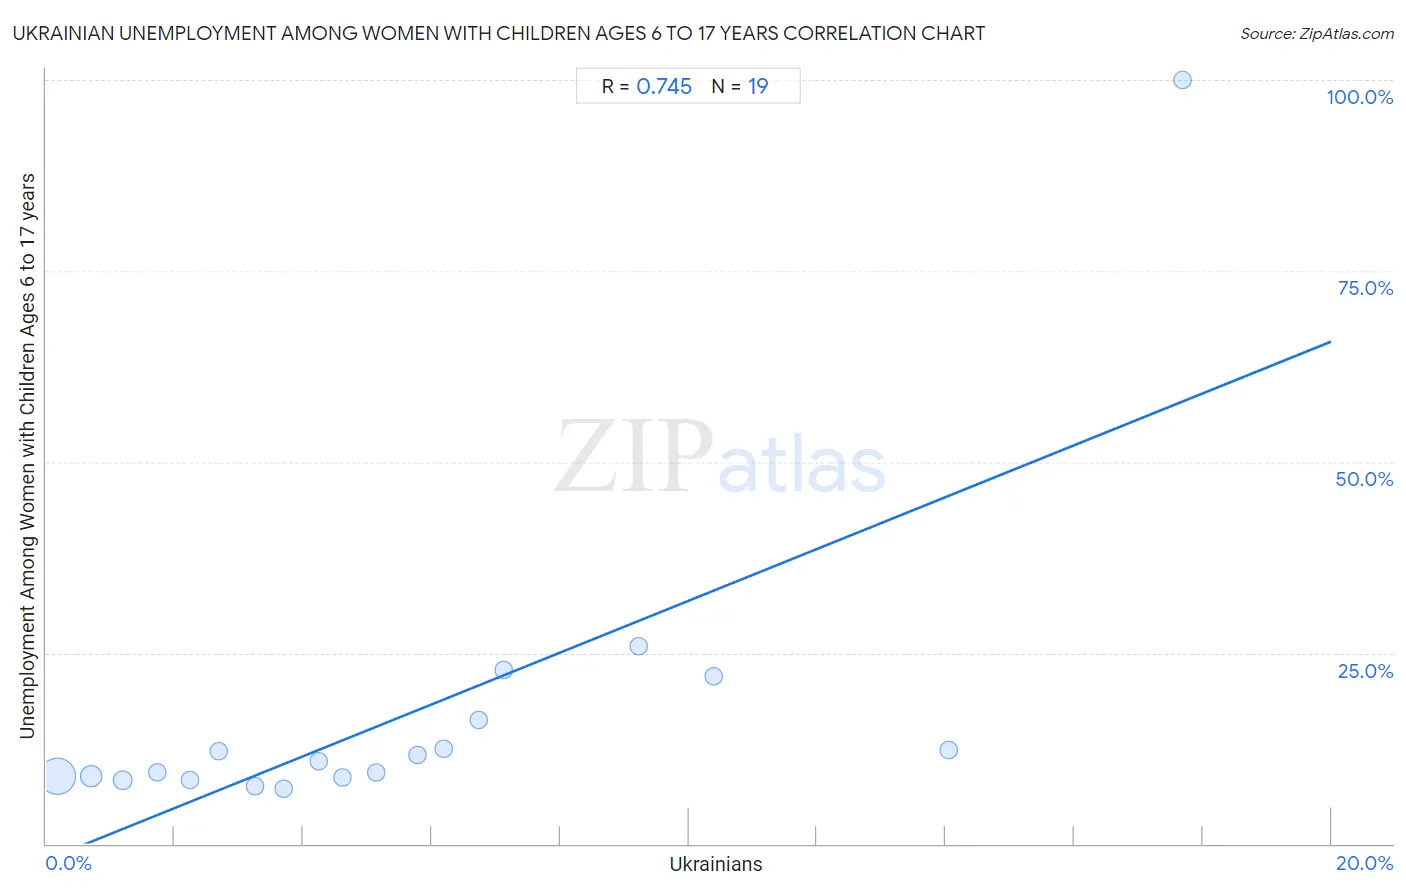
Ukrainian Unemployment Among Women with Children Ages 6 to 17 years Correlation Chart
The statistical analysis conducted on geographies consisting of 304,599,225 people shows a strong positive correlation between the proportion of Ukrainians and unemployment rate among women with children between the ages 6 and 17 in the United States with a correlation coefficient (R) of 0.745 and weighted average of 8.9%. On average, for every 1% (one percent) increase in Ukrainians within a typical geography, there is an increase of 3.4% in unemployment rate among women with children between the ages 6 and 17.
It is essential to understand that the correlation between the percentage of Ukrainians and unemployment rate among women with children between the ages 6 and 17 does not imply a direct cause-and-effect relationship. It remains uncertain whether the presence of Ukrainians influences an upward or downward trend in the level of unemployment rate among women with children between the ages 6 and 17 within an area, or if Ukrainians simply ended up residing in those areas with higher or lower levels of unemployment rate among women with children between the ages 6 and 17 due to other factors.
Demographics Similar to Ukrainians by Unemployment Among Women with Children Ages 6 to 17 years
In terms of unemployment among women with children ages 6 to 17 years, the demographic groups most similar to Ukrainians are Immigrants from Micronesia (8.9%, a difference of 0.020%), Mexican American Indian (8.9%, a difference of 0.040%), Immigrants from Netherlands (8.9%, a difference of 0.050%), Moroccan (8.9%, a difference of 0.060%), and Immigrants from England (8.9%, a difference of 0.090%).
| Demographics | Rating | Rank | Unemployment Among Women with Children Ages 6 to 17 years |
| Immigrants from Belgium | 65.6 /100 | #157 | Good 8.9% |
| Immigrants from Chile | 65.3 /100 | #158 | Good 8.9% |
| Spanish | 63.8 /100 | #159 | Good 8.9% |
| Immigrants from Hungary | 63.4 /100 | #160 | Good 8.9% |
| Immigrants from Guyana | 63.0 /100 | #161 | Good 8.9% |
| Immigrants from Netherlands | 60.8 /100 | #162 | Good 8.9% |
| Mexican American Indians | 60.6 /100 | #163 | Good 8.9% |
| Ukrainians | 59.7 /100 | #164 | Average 8.9% |
| Immigrants from Micronesia | 59.2 /100 | #165 | Average 8.9% |
| Moroccans | 58.3 /100 | #166 | Average 8.9% |
| Immigrants from England | 57.7 /100 | #167 | Average 8.9% |
| Immigrants from Croatia | 57.1 /100 | #168 | Average 8.9% |
| British | 55.2 /100 | #169 | Average 8.9% |
| Turks | 54.1 /100 | #170 | Average 8.9% |
| Jordanians | 52.2 /100 | #171 | Average 9.0% |
Ukrainian Unemployment Among Women with Children Ages 6 to 17 years Correlation Summary
| Measurement | Ukrainian Data | Unemployment Among Women with Children Ages 6 to 17 years Data |
| Minimum | 0.18% | 7.2% |
| Maximum | 17.7% | 100.0% |
| Range | 17.5% | 92.8% |
| Mean | 5.6% | 17.0% |
| Median | 4.6% | 10.8% |
| Interquartile 25% (IQ1) | 2.2% | 8.7% |
| Interquartile 75% (IQ3) | 7.1% | 16.3% |
| Interquartile Range (IQR) | 4.9% | 7.6% |
| Standard Deviation (Sample) | 4.6% | 20.8% |
| Standard Deviation (Population) | 4.5% | 20.3% |
Correlation Details
| Ukrainian Percentile | Sample Size | Unemployment Among Women with Children Ages 6 to 17 years |
[ 0.0% - 0.5% ] 0.18% | 237,492,893 | 8.8% |
[ 0.5% - 1.0% ] 0.70% | 48,742,818 | 8.8% |
[ 1.0% - 1.5% ] 1.19% | 9,981,298 | 8.3% |
[ 1.5% - 2.0% ] 1.73% | 4,028,337 | 9.4% |
[ 2.0% - 2.5% ] 2.23% | 1,535,663 | 8.3% |
[ 2.5% - 3.0% ] 2.69% | 1,294,930 | 12.2% |
[ 3.0% - 3.5% ] 3.25% | 231,893 | 7.5% |
[ 3.5% - 4.0% ] 3.70% | 514,789 | 7.2% |
[ 4.0% - 4.5% ] 4.24% | 131,308 | 10.8% |
[ 4.5% - 5.0% ] 4.62% | 233,325 | 8.7% |
[ 5.0% - 5.5% ] 5.14% | 98,198 | 9.4% |
[ 5.5% - 6.0% ] 5.79% | 137,720 | 11.7% |
[ 6.0% - 6.5% ] 6.18% | 110,965 | 12.5% |
[ 6.5% - 7.0% ] 6.74% | 49,061 | 16.3% |
[ 7.0% - 7.5% ] 7.12% | 4,469 | 22.7% |
[ 9.0% - 9.5% ] 9.23% | 8,507 | 25.9% |
[ 10.0% - 10.5% ] 10.38% | 1,233 | 22.0% |
[ 14.0% - 14.5% ] 14.05% | 1,637 | 12.2% |
[ 17.5% - 18.0% ] 17.68% | 181 | 100.0% |