Ukrainian Married-Couple Family Poverty

COMPARE

Ukrainian
Race
Ancestry
AfghanAfricanAlaska NativeAlaskan AthabascanAlbanianAleutAlsatianAmericanApacheArabArapahoArgentineanArmenianAssyrian/Chaldean/SyriacAustralianAustrianBahamianBangladeshiBarbadianBasqueBelgianBelizeanBermudanBhutaneseBlackfeetBolivianBrazilianBritishBritish West IndianBulgarianBurmeseCajunCambodianCanadianCape VerdeanCarpatho RusynCelticCentral AmericanCentral American IndianCherokeeCheyenneChickasawChileanChineseChippewaChoctawColombianColvilleComancheCosta RicanCreeCreekCroatianCrowCubanCypriotCzechCzechoslovakianDanishDelawareDominicanDutchDutch West IndianEastern EuropeanEcuadorianEgyptianEnglishEstonianEthiopianEuropeanFijianFilipinoFinnishFrenchFrench American IndianFrench CanadianGermanGerman RussianGhanaianGreekGuamanian/ChamorroGuatemalanGuyaneseHaitianHmongHonduranHopiHoumaHungarianIcelanderIndian (Asian)IndonesianInupiatIranianIraqiIrishIroquoisIsraeliItalianJamaicanJapaneseJordanianKenyanKiowaKoreanLaotianLatvianLebaneseLiberianLithuanianLumbeeLuxembourgerMacedonianMalaysianMalteseMarshalleseMenomineeMexicanMexican American IndianMongolianMoroccanNative HawaiianNavajoNepaleseNew ZealanderNicaraguanNigerianNorthern EuropeanNorwegianOkinawanOsageOttawaPaiutePakistaniPalestinianPanamanianParaguayanPennsylvania GermanPeruvianPimaPolishPortuguesePotawatomiPuebloPuerto RicanPuget Sound SalishRomanianRussianSalvadoranSamoanScandinavianScotch-IrishScottishSeminoleSenegaleseSerbianShoshoneSierra LeoneanSiouxSlavicSlovakSloveneSomaliSouth AfricanSouth AmericanSouth American IndianSoviet UnionSpaniardSpanishSpanish AmericanSpanish American IndianSri LankanSubsaharan AfricanSudaneseSwedishSwissSyrianTaiwaneseThaiTlingit-HaidaTohono O'OdhamTonganTrinidadian and TobagonianTsimshianTurkishU.S. Virgin IslanderUgandanUkrainianUruguayanUteVenezuelanVietnameseWelshWest IndianYakamaYaquiYugoslavianYumanYup'ikZimbabwean
Immigration
NonimmigrantsImmigrantsAfghanistanAfricaAlbaniaArgentinaArmeniaAsiaAustraliaAustriaBahamasBangladeshBarbadosBelarusBelgiumBelizeBoliviaBosnia and HerzegovinaBrazilBulgariaBurma/MyanmarCabo VerdeCambodiaCameroonCanadaCaribbeanCentral AmericaChileChinaColombiaCongoCosta RicaCroatiaCubaCzechoslovakiaDenmarkDominicaDominican RepublicEastern AfricaEastern AsiaEastern EuropeEcuadorEgyptEl SalvadorEnglandEritreaEthiopiaEuropeFijiFranceGermanyGhanaGreeceGrenadaGuatemalaGuyanaHaitiHondurasHong KongHungaryIndiaIndonesiaIranIraqIrelandIsraelItalyJamaicaJapanJordanKazakhstanKenyaKoreaKuwaitLaosLatin AmericaLatviaLebanonLiberiaLithuaniaMalaysiaMexicoMicronesiaMiddle AfricaMoldovaMoroccoNepalNetherlandsNicaraguaNigeriaNorth AmericaNorth MacedoniaNorthern AfricaNorthern EuropeNorwayOceaniaPakistanPanamaPeruPhilippinesPolandPortugalRomaniaRussiaSaudi ArabiaScotlandSenegalSerbiaSierra LeoneSingaporeSomaliaSouth AfricaSouth AmericaSouth Central AsiaSouth Eastern AsiaSouthern EuropeSpainSri LankaSt. Vincent and the GrenadinesSudanSwedenSwitzerlandSyriaTaiwanThailandTrinidad and TobagoTurkeyUgandaUkraineUruguayUzbekistanVenezuelaVietnamWest IndiesWestern AfricaWestern AsiaWestern EuropeYemenZaireZimbabweAzores
Select to Compare
Race
Ancestry
AfghanAfricanAlaska NativeAlaskan AthabascanAlbanianAleutAlsatianAmericanApacheArabArapahoArgentineanArmenianAssyrian/Chaldean/SyriacAustralianAustrianBahamianBangladeshiBarbadianBasqueBelgianBelizeanBermudanBhutaneseBlackfeetBolivianBrazilianBritishBritish West IndianBulgarianBurmeseCajunCambodianCanadianCape VerdeanCarpatho RusynCelticCentral AmericanCentral American IndianCherokeeCheyenneChickasawChileanChineseChippewaChoctawColombianColvilleComancheCosta RicanCreeCreekCroatianCrowCubanCypriotCzechCzechoslovakianDanishDelawareDominicanDutchDutch West IndianEastern EuropeanEcuadorianEgyptianEnglishEstonianEthiopianEuropeanFijianFilipinoFinnishFrenchFrench American IndianFrench CanadianGermanGerman RussianGhanaianGreekGuamanian/ChamorroGuatemalanGuyaneseHaitianHmongHonduranHopiHoumaHungarianIcelanderIndian (Asian)IndonesianInupiatIranianIraqiIrishIroquoisIsraeliItalianJamaicanJapaneseJordanianKenyanKiowaKoreanLaotianLatvianLebaneseLiberianLithuanianLumbeeLuxembourgerMacedonianMalaysianMalteseMarshalleseMenomineeMexicanMexican American IndianMongolianMoroccanNative HawaiianNavajoNepaleseNew ZealanderNicaraguanNigerianNorthern EuropeanNorwegianOkinawanOsageOttawaPaiutePakistaniPalestinianPanamanianParaguayanPennsylvania GermanPeruvianPimaPolishPortuguesePotawatomiPuebloPuerto RicanPuget Sound SalishRomanianRussianSalvadoranSamoanScandinavianScotch-IrishScottishSeminoleSenegaleseSerbianShoshoneSierra LeoneanSiouxSlavicSlovakSloveneSomaliSouth AfricanSouth AmericanSouth American IndianSoviet UnionSpaniardSpanishSpanish AmericanSpanish American IndianSri LankanSubsaharan AfricanSudaneseSwedishSwissSyrianTaiwaneseThaiTlingit-HaidaTohono O'OdhamTonganTrinidadian and TobagonianTsimshianTurkishU.S. Virgin IslanderUgandanUruguayanUteVenezuelanVietnameseWelshWest IndianYakamaYaquiYugoslavianYumanYup'ikZimbabwean
Immigration
NonimmigrantsImmigrantsAfghanistanAfricaAlbaniaArgentinaArmeniaAsiaAustraliaAustriaBahamasBangladeshBarbadosBelarusBelgiumBelizeBoliviaBosnia and HerzegovinaBrazilBulgariaBurma/MyanmarCabo VerdeCambodiaCameroonCanadaCaribbeanCentral AmericaChileChinaColombiaCongoCosta RicaCroatiaCubaCzechoslovakiaDenmarkDominicaDominican RepublicEastern AfricaEastern AsiaEastern EuropeEcuadorEgyptEl SalvadorEnglandEritreaEthiopiaEuropeFijiFranceGermanyGhanaGreeceGrenadaGuatemalaGuyanaHaitiHondurasHong KongHungaryIndiaIndonesiaIranIraqIrelandIsraelItalyJamaicaJapanJordanKazakhstanKenyaKoreaKuwaitLaosLatin AmericaLatviaLebanonLiberiaLithuaniaMalaysiaMexicoMicronesiaMiddle AfricaMoldovaMoroccoNepalNetherlandsNicaraguaNigeriaNorth AmericaNorth MacedoniaNorthern AfricaNorthern EuropeNorwayOceaniaPakistanPanamaPeruPhilippinesPolandPortugalRomaniaRussiaSaudi ArabiaScotlandSenegalSerbiaSierra LeoneSingaporeSomaliaSouth AfricaSouth AmericaSouth Central AsiaSouth Eastern AsiaSouthern EuropeSpainSri LankaSt. Vincent and the GrenadinesSudanSwedenSwitzerlandSyriaTaiwanThailandTrinidad and TobagoTurkeyUgandaUkraineUruguayUzbekistanVenezuelaVietnamWest IndiesWestern AfricaWestern AsiaWestern EuropeYemenZaireZimbabweAzores
Married-Couple Family Poverty
Income
Poverty
Unemployment
Labor Participation
Family Structure
Vehicle Availability
Education Level
Disability

Ukrainian Married-Couple Family Poverty
Exceptional

4.5%
POVERTY | MARRIED-COUPLE FAMILIES
99.2/ 100
METRIC RATING
73rd/ 347
METRIC RANK

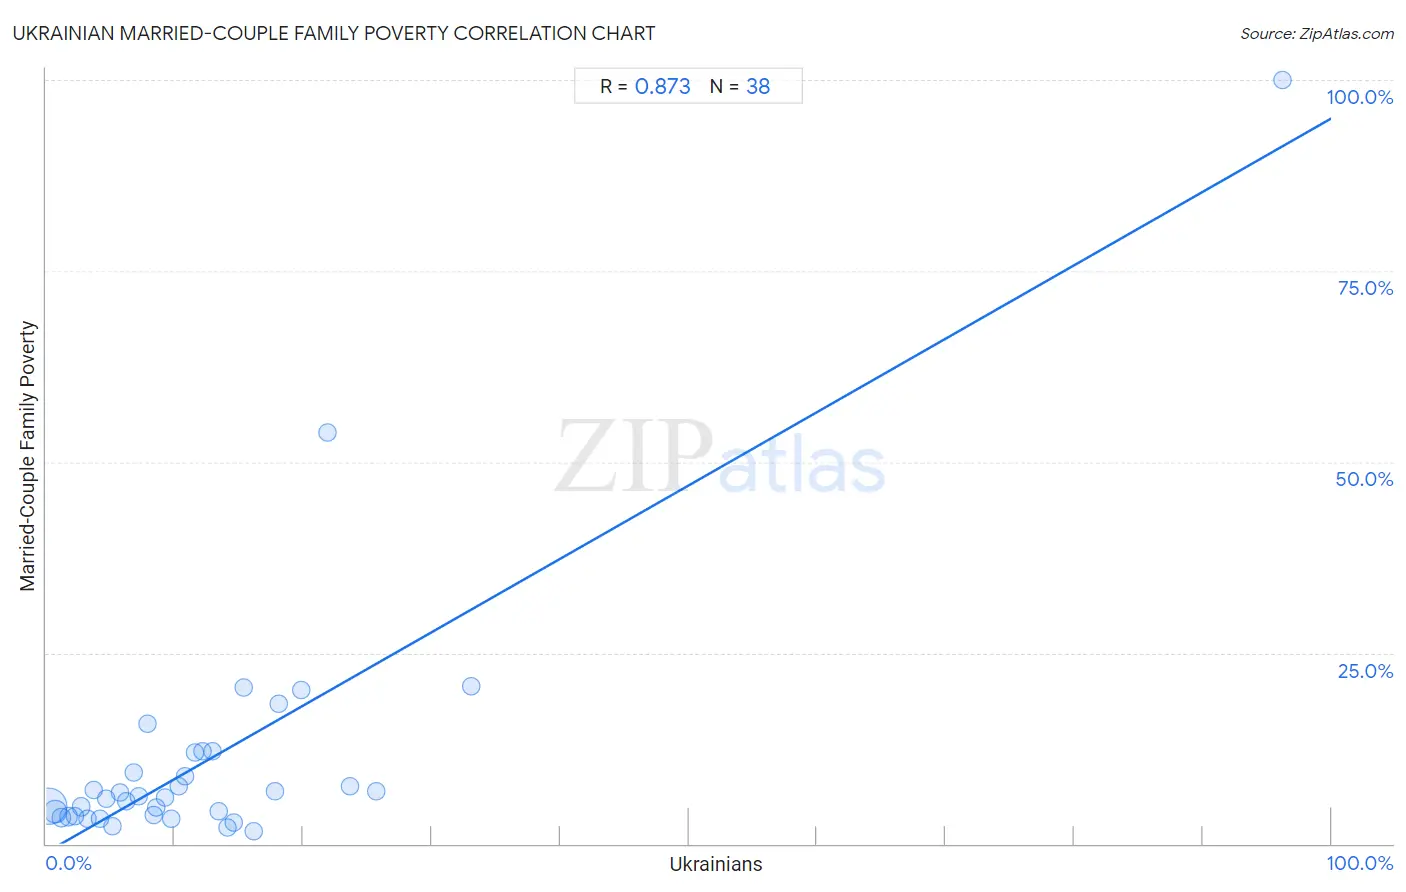
Ukrainian Married-Couple Family Poverty Correlation Chart

The statistical analysis conducted on geographies consisting of 441,666,258 people shows a very strong positive correlation between the proportion of Ukrainians and poverty level among married-couple families in the United States with a correlation coefficient (R) of 0.873 and weighted average of 4.5%. On average, for every 1% (one percent) increase in Ukrainians within a typical geography, there is an increase of 0.96% in poverty level among married-couple families.
Ukrainian Married-Couple Family Poverty
It is essential to understand that the correlation between the percentage of Ukrainians and poverty level among married-couple families does not imply a direct cause-and-effect relationship. It remains uncertain whether the presence of Ukrainians influences an upward or downward trend in the level of poverty level among married-couple families within an area, or if Ukrainians simply ended up residing in those areas with higher or lower levels of poverty level among married-couple families due to other factors.

Demographics Similar to Ukrainians by Married-Couple Family Poverty

In terms of married-couple family poverty, the demographic groups most similar to Ukrainians are Immigrants from Austria (4.5%, a difference of 0.10%), Immigrants from England (4.5%, a difference of 0.12%), Immigrants from North America (4.5%, a difference of 0.22%), Cambodian (4.5%, a difference of 0.37%), and Immigrants from South Africa (4.5%, a difference of 0.48%).
DemographicsRating | RankMarried-Couple Family Poverty
Immigrants from Serbia
99.4
/100
|
#66
Exceptional
4.4%
Immigrants from Canada
99.4
/100
|
#67
Exceptional
4.4%
Slavs
99.4
/100
|
#68
Exceptional
4.4%
New Zealanders
99.4
/100
|
#69
Exceptional
4.4%
Immigrants from Korea
99.4
/100
|
#70
Exceptional
4.5%
Immigrants from North America
99.3
/100
|
#71
Exceptional
4.5%
Immigrants from England
99.3
/100
|
#72
Exceptional
4.5%
Ukrainians
99.2
/100
|
#73
Exceptional
4.5%
Immigrants from Austria
99.2
/100
|
#74
Exceptional
4.5%
Cambodians
99.2
/100
|
#75
Exceptional
4.5%
Immigrants from South Africa
99.1
/100
|
#76
Exceptional
4.5%
Immigrants from Latvia
99.1
/100
|
#77
Exceptional
4.5%
Scotch-Irish
99.1
/100
|
#78
Exceptional
4.5%
Immigrants from Iran
99.0
/100
|
#79
Exceptional
4.5%
Icelanders
99.0
/100
|
#80
Exceptional
4.5%

Ukrainian Married-Couple Family Poverty Correlation Summary

MeasurementUkrainian DataMarried-Couple Family Poverty Data
Minimum0.19%1.6%
Maximum96.2%100.0%
Range96.0%98.4%
Mean12.8%11.2%
Median9.5%6.1%
Interquartile 25% (IQ1)4.7%3.7%
Interquartile 75% (IQ3)15.3%12.0%
Interquartile Range (IQR)10.7%8.3%
Standard Deviation (Sample)15.8%17.4%
Standard Deviation (Population)15.6%17.2%

Correlation Details

Ukrainian PercentileSample SizeMarried-Couple Family Poverty
[
0.0%
-
0.5%
]
0.19%
331,306,8045.0%
[
0.5%
-
1.0%
]
0.70%
76,281,3034.2%
[
1.0%
-
1.5%
]
1.19%
18,403,8193.4%
[
1.5%
-
2.0%
]
1.73%
7,679,1813.6%
[
2.0%
-
2.5%
]
2.24%
2,697,0633.7%
[
2.5%
-
3.0%
]
2.70%
2,219,1814.8%
[
3.0%
-
3.5%
]
3.25%
630,6143.2%
[
3.5%
-
4.0%
]
3.73%
755,9757.1%
[
4.0%
-
4.5%
]
4.19%
351,6893.3%
[
4.5%
-
5.0%
]
4.66%
348,4195.9%
[
5.0%
-
5.5%
]
5.19%
132,9062.3%
[
5.5%
-
6.0%
]
5.76%
290,7216.7%
[
6.0%
-
6.5%
]
6.20%
138,5215.5%
[
6.5%
-
7.0%
]
6.82%
102,0929.3%
[
7.0%
-
7.5%
]
7.17%
69,4896.2%
[
7.5%
-
8.0%
]
7.85%
3,21015.7%
[
8.0%
-
8.5%
]
8.38%
80,2463.7%
[
8.5%
-
9.0%
]
8.52%
49,2774.7%
[
9.0%
-
9.5%
]
9.21%
9,9896.1%
[
9.5%
-
10.0%
]
9.71%
11,4413.2%
[
10.0%
-
10.5%
]
10.27%
2,4737.5%
[
10.5%
-
11.0%
]
10.82%
1,6088.8%
[
11.5%
-
12.0%
]
11.60%
84,84612.0%
[
12.0%
-
12.5%
]
12.15%
96312.1%
[
12.5%
-
13.0%
]
12.94%
1,77812.1%
[
13.0%
-
13.5%
]
13.39%
3,2194.2%
[
14.0%
-
14.5%
]
14.06%
2,0272.1%
[
14.5%
-
15.0%
]
14.56%
1,1952.7%
[
15.0%
-
15.5%
]
15.32%
38520.4%
[
16.0%
-
16.5%
]
16.15%
1,8641.6%
[
17.5%
-
18.0%
]
17.78%
4786.9%
[
18.0%
-
18.5%
]
18.08%
96818.3%
[
19.5%
-
20.0%
]
19.86%
74020.1%
[
21.5%
-
22.0%
]
21.84%
8753.8%
[
23.5%
-
24.0%
]
23.67%
3007.5%
[
25.5%
-
26.0%
]
25.65%
3826.8%
[
33.0%
-
33.5%
]
33.09%
95220.6%
[
96.0%
-
96.5%
]
96.23%
53100.0%