Ukrainian Disability
COMPARE
Ukrainian
Select to Compare
Disability
Ukrainian Disability
11.9%
DISABILITY
14.7/ 100
METRIC RATING
198th/ 347
METRIC RANK
Ukrainian Disability Correlation Chart
The statistical analysis conducted on geographies consisting of 448,640,628 people shows a weak positive correlation between the proportion of Ukrainians and percentage of population with a disability in the United States with a correlation coefficient (R) of 0.265 and weighted average of 11.9%. On average, for every 1% (one percent) increase in Ukrainians within a typical geography, there is an increase of 0.16% in percentage of population with a disability.
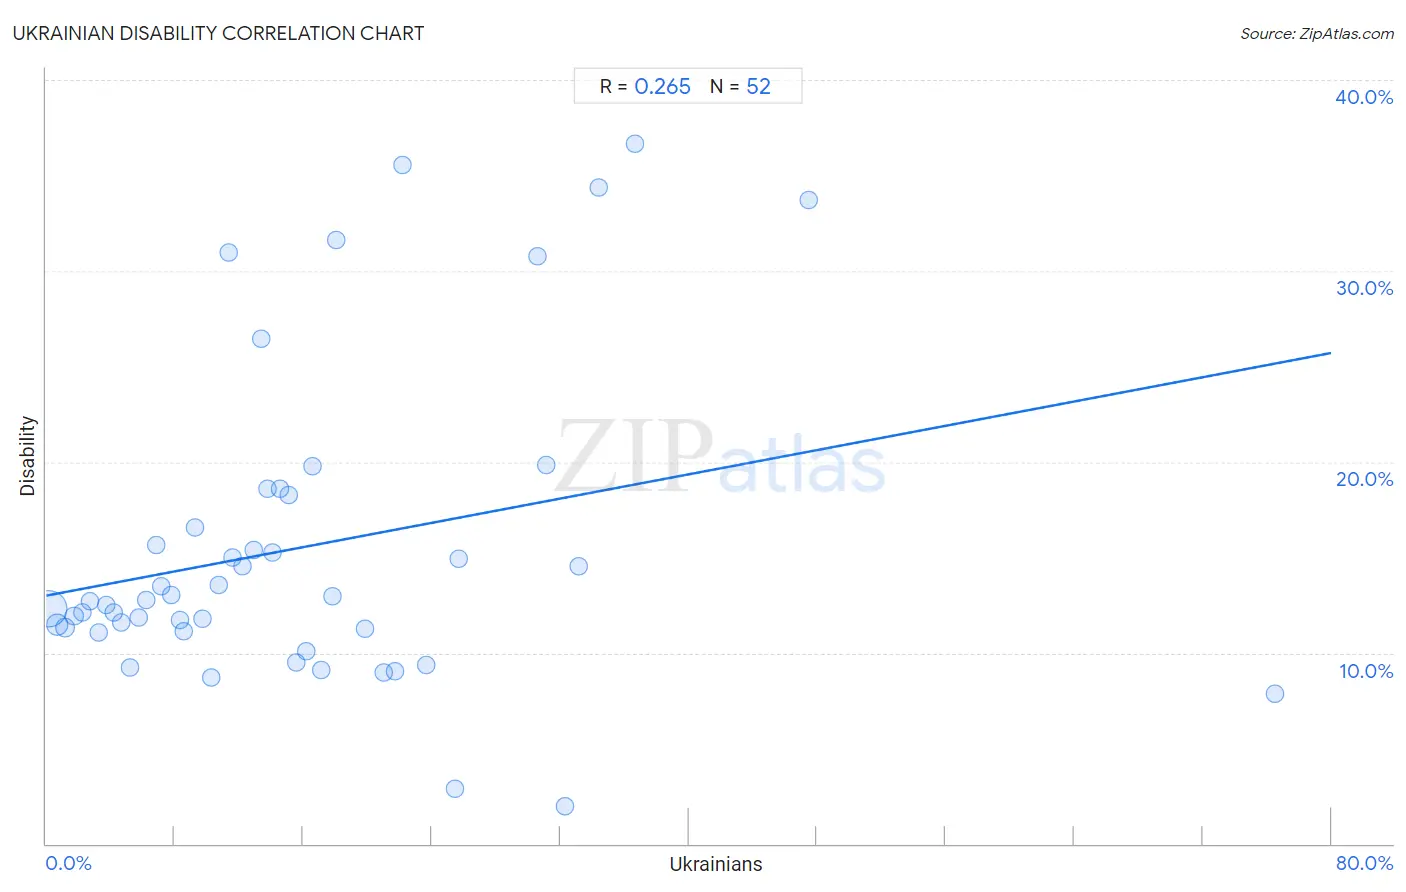
It is essential to understand that the correlation between the percentage of Ukrainians and percentage of population with a disability does not imply a direct cause-and-effect relationship. It remains uncertain whether the presence of Ukrainians influences an upward or downward trend in the level of percentage of population with a disability within an area, or if Ukrainians simply ended up residing in those areas with higher or lower levels of percentage of population with a disability due to other factors.
Demographics Similar to Ukrainians by Disability
In terms of disability, the demographic groups most similar to Ukrainians are Immigrants from Panama (11.9%, a difference of 0.010%), Immigrants from Belize (11.9%, a difference of 0.050%), Serbian (11.9%, a difference of 0.060%), Barbadian (11.9%, a difference of 0.10%), and Belizean (11.9%, a difference of 0.17%).
| Demographics | Rating | Rank | Disability |
| Ute | 19.5 /100 | #191 | Poor 11.9% |
| Lithuanians | 18.8 /100 | #192 | Poor 11.9% |
| Immigrants from Bosnia and Herzegovina | 18.0 /100 | #193 | Poor 11.9% |
| Somalis | 17.3 /100 | #194 | Poor 11.9% |
| Barbadians | 15.8 /100 | #195 | Poor 11.9% |
| Serbians | 15.4 /100 | #196 | Poor 11.9% |
| Immigrants from Belize | 15.2 /100 | #197 | Poor 11.9% |
| Ukrainians | 14.7 /100 | #198 | Poor 11.9% |
| Immigrants from Panama | 14.6 /100 | #199 | Poor 11.9% |
| Belizeans | 12.8 /100 | #200 | Poor 11.9% |
| Assyrians/Chaldeans/Syriacs | 12.6 /100 | #201 | Poor 11.9% |
| Immigrants from England | 12.0 /100 | #202 | Poor 12.0% |
| British West Indians | 11.5 /100 | #203 | Poor 12.0% |
| Mexican American Indians | 11.4 /100 | #204 | Poor 12.0% |
| Immigrants from Western Europe | 10.1 /100 | #205 | Poor 12.0% |
Ukrainian Disability Correlation Summary
| Measurement | Ukrainian Data | Disability Data |
| Minimum | 0.19% | 1.9% |
| Maximum | 76.5% | 36.7% |
| Range | 76.3% | 34.7% |
| Mean | 15.8% | 15.5% |
| Median | 13.1% | 12.7% |
| Interquartile 25% (IQ1) | 6.5% | 11.2% |
| Interquartile 75% (IQ3) | 21.3% | 17.4% |
| Interquartile Range (IQR) | 14.8% | 6.2% |
| Standard Deviation (Sample) | 13.7% | 8.2% |
| Standard Deviation (Population) | 13.5% | 8.1% |
Correlation Details
| Ukrainian Percentile | Sample Size | Disability |
[ 0.0% - 0.5% ] 0.19% | 334,757,992 | 12.3% |
[ 0.5% - 1.0% ] 0.70% | 78,136,770 | 11.5% |
[ 1.0% - 1.5% ] 1.19% | 19,142,675 | 11.3% |
[ 1.5% - 2.0% ] 1.73% | 7,981,823 | 11.9% |
[ 2.0% - 2.5% ] 2.24% | 2,931,109 | 12.1% |
[ 2.5% - 3.0% ] 2.70% | 2,330,659 | 12.7% |
[ 3.0% - 3.5% ] 3.25% | 709,282 | 11.0% |
[ 3.5% - 4.0% ] 3.73% | 802,077 | 12.5% |
[ 4.0% - 4.5% ] 4.20% | 384,575 | 12.1% |
[ 4.5% - 5.0% ] 4.68% | 385,130 | 11.6% |
[ 5.0% - 5.5% ] 5.19% | 142,408 | 9.2% |
[ 5.5% - 6.0% ] 5.76% | 306,035 | 11.8% |
[ 6.0% - 6.5% ] 6.20% | 146,822 | 12.8% |
[ 6.5% - 7.0% ] 6.82% | 104,799 | 15.6% |
[ 7.0% - 7.5% ] 7.17% | 74,972 | 13.5% |
[ 7.5% - 8.0% ] 7.81% | 8,698 | 13.0% |
[ 8.0% - 8.5% ] 8.37% | 87,968 | 11.7% |
[ 8.5% - 9.0% ] 8.56% | 56,963 | 11.1% |
[ 9.0% - 9.5% ] 9.23% | 12,603 | 16.6% |
[ 9.5% - 10.0% ] 9.71% | 11,564 | 11.8% |
[ 10.0% - 10.5% ] 10.30% | 7,030 | 8.7% |
[ 10.5% - 11.0% ] 10.73% | 5,078 | 13.6% |
[ 11.0% - 11.5% ] 11.36% | 546 | 31.0% |
[ 11.5% - 12.0% ] 11.61% | 85,934 | 15.0% |
[ 12.0% - 12.5% ] 12.22% | 2,569 | 14.5% |
[ 12.5% - 13.0% ] 12.89% | 2,079 | 15.4% |
[ 13.0% - 13.5% ] 13.38% | 3,566 | 26.5% |
[ 13.5% - 14.0% ] 13.78% | 312 | 18.6% |
[ 14.0% - 14.5% ] 14.07% | 2,097 | 15.3% |
[ 14.5% - 15.0% ] 14.58% | 1,365 | 18.6% |
[ 15.0% - 15.5% ] 15.13% | 998 | 18.2% |
[ 15.5% - 16.0% ] 15.58% | 1,348 | 9.5% |
[ 16.0% - 16.5% ] 16.17% | 3,031 | 10.1% |
[ 16.5% - 17.0% ] 16.60% | 476 | 19.7% |
[ 17.0% - 17.5% ] 17.10% | 690 | 9.1% |
[ 17.5% - 18.0% ] 17.78% | 478 | 13.0% |
[ 18.0% - 18.5% ] 18.08% | 968 | 31.6% |
[ 19.5% - 20.0% ] 19.85% | 1,355 | 11.3% |
[ 20.5% - 21.0% ] 21.00% | 581 | 9.0% |
[ 21.5% - 22.0% ] 21.69% | 166 | 9.0% |
[ 22.0% - 22.5% ] 22.16% | 388 | 35.6% |
[ 23.5% - 24.0% ] 23.67% | 300 | 9.3% |
[ 25.0% - 25.5% ] 25.46% | 491 | 2.9% |
[ 25.5% - 26.0% ] 25.65% | 382 | 14.9% |
[ 30.5% - 31.0% ] 30.60% | 974 | 30.8% |
[ 31.0% - 31.5% ] 31.13% | 257 | 19.8% |
[ 32.0% - 32.5% ] 32.26% | 155 | 1.9% |
[ 33.0% - 33.5% ] 33.14% | 1,536 | 14.5% |
[ 34.0% - 34.5% ] 34.38% | 64 | 34.4% |
[ 36.5% - 37.0% ] 36.67% | 30 | 36.7% |
[ 47.0% - 47.5% ] 47.43% | 409 | 33.7% |
[ 76.0% - 76.5% ] 76.47% | 51 | 7.8% |