Ukrainian GED/Equivalency

COMPARE

Ukrainian
Race
Ancestry
AfghanAfricanAlaska NativeAlaskan AthabascanAlbanianAleutAlsatianAmericanApacheArabArapahoArgentineanArmenianAssyrian/Chaldean/SyriacAustralianAustrianBahamianBangladeshiBarbadianBasqueBelgianBelizeanBermudanBhutaneseBlackfeetBolivianBrazilianBritishBritish West IndianBulgarianBurmeseCajunCambodianCanadianCape VerdeanCarpatho RusynCelticCentral AmericanCentral American IndianCherokeeCheyenneChickasawChileanChineseChippewaChoctawColombianColvilleComancheCosta RicanCreeCreekCroatianCrowCubanCypriotCzechCzechoslovakianDanishDelawareDominicanDutchDutch West IndianEastern EuropeanEcuadorianEgyptianEnglishEstonianEthiopianEuropeanFijianFilipinoFinnishFrenchFrench American IndianFrench CanadianGermanGerman RussianGhanaianGreekGuamanian/ChamorroGuatemalanGuyaneseHaitianHmongHonduranHopiHoumaHungarianIcelanderIndian (Asian)IndonesianInupiatIranianIraqiIrishIroquoisIsraeliItalianJamaicanJapaneseJordanianKenyanKiowaKoreanLaotianLatvianLebaneseLiberianLithuanianLumbeeLuxembourgerMacedonianMalaysianMalteseMarshalleseMenomineeMexicanMexican American IndianMongolianMoroccanNative HawaiianNavajoNepaleseNew ZealanderNicaraguanNigerianNorthern EuropeanNorwegianOkinawanOsageOttawaPaiutePakistaniPalestinianPanamanianParaguayanPennsylvania GermanPeruvianPimaPolishPortuguesePotawatomiPuebloPuerto RicanPuget Sound SalishRomanianRussianSalvadoranSamoanScandinavianScotch-IrishScottishSeminoleSenegaleseSerbianShoshoneSierra LeoneanSiouxSlavicSlovakSloveneSomaliSouth AfricanSouth AmericanSouth American IndianSoviet UnionSpaniardSpanishSpanish AmericanSpanish American IndianSri LankanSubsaharan AfricanSudaneseSwedishSwissSyrianTaiwaneseThaiTlingit-HaidaTohono O'OdhamTonganTrinidadian and TobagonianTsimshianTurkishU.S. Virgin IslanderUgandanUkrainianUruguayanUteVenezuelanVietnameseWelshWest IndianYakamaYaquiYugoslavianYumanYup'ikZimbabwean
Immigration
NonimmigrantsImmigrantsAfghanistanAfricaAlbaniaArgentinaArmeniaAsiaAustraliaAustriaBahamasBangladeshBarbadosBelarusBelgiumBelizeBoliviaBosnia and HerzegovinaBrazilBulgariaBurma/MyanmarCabo VerdeCambodiaCameroonCanadaCaribbeanCentral AmericaChileChinaColombiaCongoCosta RicaCroatiaCubaCzechoslovakiaDenmarkDominicaDominican RepublicEastern AfricaEastern AsiaEastern EuropeEcuadorEgyptEl SalvadorEnglandEritreaEthiopiaEuropeFijiFranceGermanyGhanaGreeceGrenadaGuatemalaGuyanaHaitiHondurasHong KongHungaryIndiaIndonesiaIranIraqIrelandIsraelItalyJamaicaJapanJordanKazakhstanKenyaKoreaKuwaitLaosLatin AmericaLatviaLebanonLiberiaLithuaniaMalaysiaMexicoMicronesiaMiddle AfricaMoldovaMoroccoNepalNetherlandsNicaraguaNigeriaNorth AmericaNorth MacedoniaNorthern AfricaNorthern EuropeNorwayOceaniaPakistanPanamaPeruPhilippinesPolandPortugalRomaniaRussiaSaudi ArabiaScotlandSenegalSerbiaSierra LeoneSingaporeSomaliaSouth AfricaSouth AmericaSouth Central AsiaSouth Eastern AsiaSouthern EuropeSpainSri LankaSt. Vincent and the GrenadinesSudanSwedenSwitzerlandSyriaTaiwanThailandTrinidad and TobagoTurkeyUgandaUkraineUruguayUzbekistanVenezuelaVietnamWest IndiesWestern AfricaWestern AsiaWestern EuropeYemenZaireZimbabweAzores
Select to Compare
Race
Ancestry
AfghanAfricanAlaska NativeAlaskan AthabascanAlbanianAleutAlsatianAmericanApacheArabArapahoArgentineanArmenianAssyrian/Chaldean/SyriacAustralianAustrianBahamianBangladeshiBarbadianBasqueBelgianBelizeanBermudanBhutaneseBlackfeetBolivianBrazilianBritishBritish West IndianBulgarianBurmeseCajunCambodianCanadianCape VerdeanCarpatho RusynCelticCentral AmericanCentral American IndianCherokeeCheyenneChickasawChileanChineseChippewaChoctawColombianColvilleComancheCosta RicanCreeCreekCroatianCrowCubanCypriotCzechCzechoslovakianDanishDelawareDominicanDutchDutch West IndianEastern EuropeanEcuadorianEgyptianEnglishEstonianEthiopianEuropeanFijianFilipinoFinnishFrenchFrench American IndianFrench CanadianGermanGerman RussianGhanaianGreekGuamanian/ChamorroGuatemalanGuyaneseHaitianHmongHonduranHopiHoumaHungarianIcelanderIndian (Asian)IndonesianInupiatIranianIraqiIrishIroquoisIsraeliItalianJamaicanJapaneseJordanianKenyanKiowaKoreanLaotianLatvianLebaneseLiberianLithuanianLumbeeLuxembourgerMacedonianMalaysianMalteseMarshalleseMenomineeMexicanMexican American IndianMongolianMoroccanNative HawaiianNavajoNepaleseNew ZealanderNicaraguanNigerianNorthern EuropeanNorwegianOkinawanOsageOttawaPaiutePakistaniPalestinianPanamanianParaguayanPennsylvania GermanPeruvianPimaPolishPortuguesePotawatomiPuebloPuerto RicanPuget Sound SalishRomanianRussianSalvadoranSamoanScandinavianScotch-IrishScottishSeminoleSenegaleseSerbianShoshoneSierra LeoneanSiouxSlavicSlovakSloveneSomaliSouth AfricanSouth AmericanSouth American IndianSoviet UnionSpaniardSpanishSpanish AmericanSpanish American IndianSri LankanSubsaharan AfricanSudaneseSwedishSwissSyrianTaiwaneseThaiTlingit-HaidaTohono O'OdhamTonganTrinidadian and TobagonianTsimshianTurkishU.S. Virgin IslanderUgandanUruguayanUteVenezuelanVietnameseWelshWest IndianYakamaYaquiYugoslavianYumanYup'ikZimbabwean
Immigration
NonimmigrantsImmigrantsAfghanistanAfricaAlbaniaArgentinaArmeniaAsiaAustraliaAustriaBahamasBangladeshBarbadosBelarusBelgiumBelizeBoliviaBosnia and HerzegovinaBrazilBulgariaBurma/MyanmarCabo VerdeCambodiaCameroonCanadaCaribbeanCentral AmericaChileChinaColombiaCongoCosta RicaCroatiaCubaCzechoslovakiaDenmarkDominicaDominican RepublicEastern AfricaEastern AsiaEastern EuropeEcuadorEgyptEl SalvadorEnglandEritreaEthiopiaEuropeFijiFranceGermanyGhanaGreeceGrenadaGuatemalaGuyanaHaitiHondurasHong KongHungaryIndiaIndonesiaIranIraqIrelandIsraelItalyJamaicaJapanJordanKazakhstanKenyaKoreaKuwaitLaosLatin AmericaLatviaLebanonLiberiaLithuaniaMalaysiaMexicoMicronesiaMiddle AfricaMoldovaMoroccoNepalNetherlandsNicaraguaNigeriaNorth AmericaNorth MacedoniaNorthern AfricaNorthern EuropeNorwayOceaniaPakistanPanamaPeruPhilippinesPolandPortugalRomaniaRussiaSaudi ArabiaScotlandSenegalSerbiaSierra LeoneSingaporeSomaliaSouth AfricaSouth AmericaSouth Central AsiaSouth Eastern AsiaSouthern EuropeSpainSri LankaSt. Vincent and the GrenadinesSudanSwedenSwitzerlandSyriaTaiwanThailandTrinidad and TobagoTurkeyUgandaUkraineUruguayUzbekistanVenezuelaVietnamWest IndiesWestern AfricaWestern AsiaWestern EuropeYemenZaireZimbabweAzores
GED/Equivalency
Income
Poverty
Unemployment
Labor Participation
Family Structure
Vehicle Availability
Education Level
Disability

Ukrainian GED/Equivalency
Exceptional

87.7%
GED/EQUIVALENCY
98.8/ 100
METRIC RATING
70th/ 347
METRIC RANK

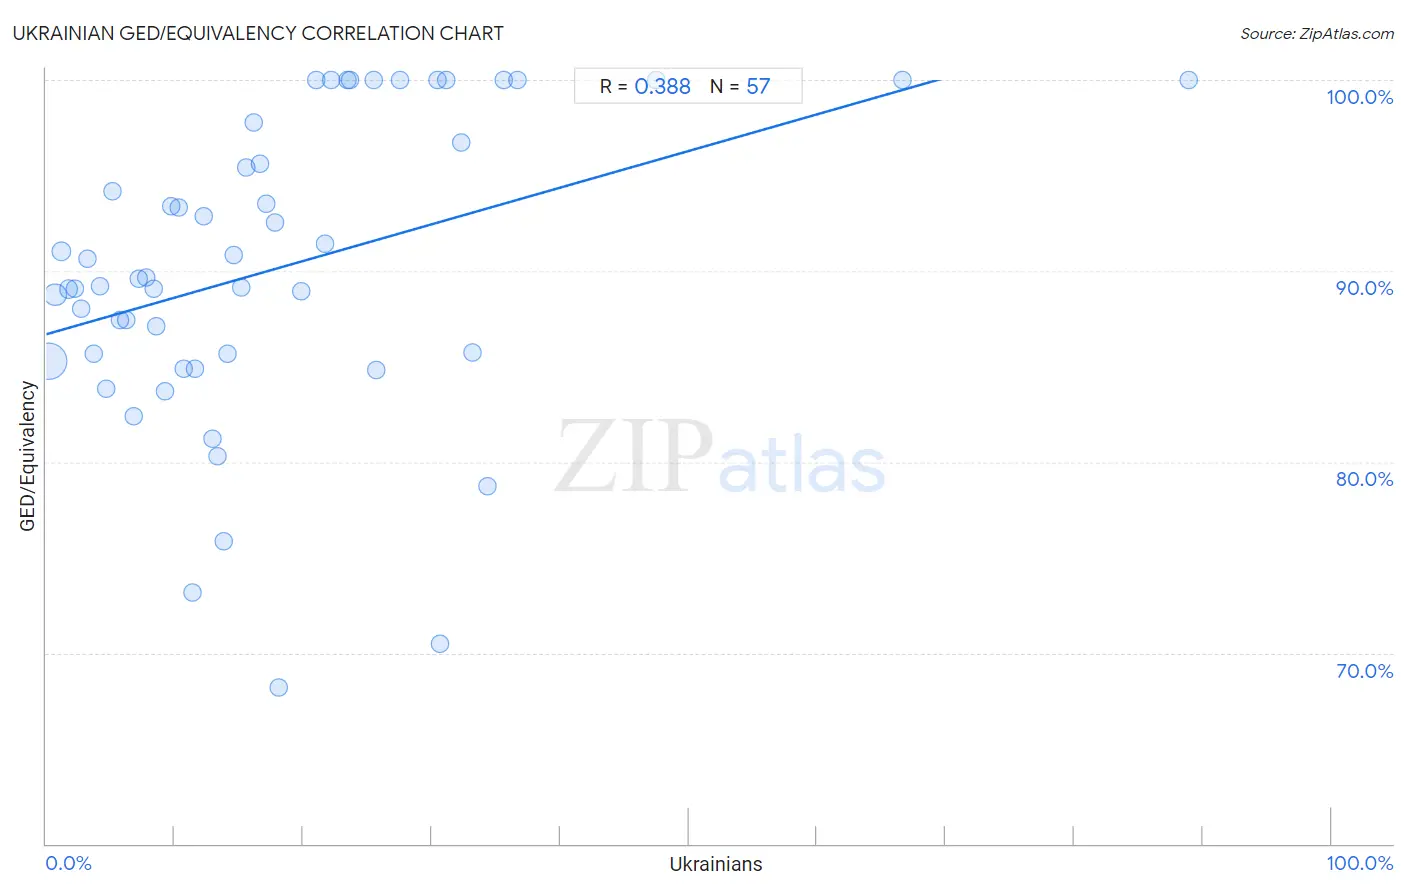
Ukrainian GED/Equivalency Correlation Chart

The statistical analysis conducted on geographies consisting of 448,698,772 people shows a mild positive correlation between the proportion of Ukrainians and percentage of population with at least ged/equivalency education in the United States with a correlation coefficient (R) of 0.388 and weighted average of 87.7%. On average, for every 1% (one percent) increase in Ukrainians within a typical geography, there is an increase of 0.19% in percentage of population with at least ged/equivalency education.
Ukrainian GED/Equivalency
It is essential to understand that the correlation between the percentage of Ukrainians and percentage of population with at least ged/equivalency education does not imply a direct cause-and-effect relationship. It remains uncertain whether the presence of Ukrainians influences an upward or downward trend in the level of percentage of population with at least ged/equivalency education within an area, or if Ukrainians simply ended up residing in those areas with higher or lower levels of percentage of population with at least ged/equivalency education due to other factors.

Demographics Similar to Ukrainians by GED/Equivalency

In terms of ged/equivalency, the demographic groups most similar to Ukrainians are Austrian (87.7%, a difference of 0.0%), Immigrants from Moldova (87.7%, a difference of 0.0%), Belgian (87.7%, a difference of 0.010%), Immigrants from Kuwait (87.7%, a difference of 0.030%), and Immigrants from Saudi Arabia (87.8%, a difference of 0.050%).
DemographicsRating | RankGED/Equivalency
Immigrants from Turkey
99.2
/100
|
#63
Exceptional
87.9%
Immigrants from Canada
99.2
/100
|
#64
Exceptional
87.9%
Immigrants from North America
99.1
/100
|
#65
Exceptional
87.8%
Immigrants from Bulgaria
99.1
/100
|
#66
Exceptional
87.8%
British
99.1
/100
|
#67
Exceptional
87.8%
Immigrants from France
99.1
/100
|
#68
Exceptional
87.8%
Immigrants from Saudi Arabia
99.0
/100
|
#69
Exceptional
87.8%
Ukrainians
98.8
/100
|
#70
Exceptional
87.7%
Austrians
98.8
/100
|
#71
Exceptional
87.7%
Immigrants from Moldova
98.8
/100
|
#72
Exceptional
87.7%
Belgians
98.8
/100
|
#73
Exceptional
87.7%
Immigrants from Kuwait
98.8
/100
|
#74
Exceptional
87.7%
Scottish
98.7
/100
|
#75
Exceptional
87.7%
Immigrants from Serbia
98.7
/100
|
#76
Exceptional
87.7%
Slavs
98.7
/100
|
#77
Exceptional
87.7%

Ukrainian GED/Equivalency Correlation Summary

MeasurementUkrainian DataGED/Equivalency Data
Minimum0.19%68.2%
Maximum88.9%100.0%
Range88.7%31.8%
Mean17.9%90.1%
Median14.1%89.6%
Interquartile 25% (IQ1)7.0%85.5%
Interquartile 75% (IQ3)24.6%97.3%
Interquartile Range (IQR)17.6%11.8%
Standard Deviation (Sample)16.0%7.9%
Standard Deviation (Population)15.8%7.8%

Correlation Details

Ukrainian PercentileSample SizeGED/Equivalency
[
0.0%
-
0.5%
]
0.19%
334,804,92285.3%
[
0.5%
-
1.0%
]
0.70%
78,134,27588.8%
[
1.0%
-
1.5%
]
1.19%
19,147,70291.0%
[
1.5%
-
2.0%
]
1.73%
7,984,71089.0%
[
2.0%
-
2.5%
]
2.24%
2,931,10989.1%
[
2.5%
-
3.0%
]
2.70%
2,332,77988.0%
[
3.0%
-
3.5%
]
3.25%
709,98190.6%
[
3.5%
-
4.0%
]
3.73%
803,01785.7%
[
4.0%
-
4.5%
]
4.20%
384,57589.2%
[
4.5%
-
5.0%
]
4.68%
385,37183.8%
[
5.0%
-
5.5%
]
5.19%
142,40894.2%
[
5.5%
-
6.0%
]
5.76%
306,10787.4%
[
6.0%
-
6.5%
]
6.20%
146,82287.4%
[
6.5%
-
7.0%
]
6.82%
105,36082.4%
[
7.0%
-
7.5%
]
7.17%
75,10789.6%
[
7.5%
-
8.0%
]
7.81%
8,71189.7%
[
8.0%
-
8.5%
]
8.37%
88,11789.1%
[
8.5%
-
9.0%
]
8.56%
56,96387.1%
[
9.0%
-
9.5%
]
9.23%
12,60383.7%
[
9.5%
-
10.0%
]
9.71%
11,56493.4%
[
10.0%
-
10.5%
]
10.30%
7,03093.3%
[
10.5%
-
11.0%
]
10.73%
5,07884.9%
[
11.0%
-
11.5%
]
11.36%
54673.1%
[
11.5%
-
12.0%
]
11.61%
85,95984.9%
[
12.0%
-
12.5%
]
12.22%
2,62692.9%
[
12.5%
-
13.0%
]
12.89%
2,07981.2%
[
13.0%
-
13.5%
]
13.37%
3,58980.3%
[
13.5%
-
14.0%
]
13.78%
31275.8%
[
14.0%
-
14.5%
]
14.07%
2,09785.7%
[
14.5%
-
15.0%
]
14.58%
1,36590.8%
[
15.0%
-
15.5%
]
15.15%
1,09689.1%
[
15.5%
-
16.0%
]
15.58%
1,34895.4%
[
16.0%
-
16.5%
]
16.17%
3,03197.8%
[
16.5%
-
17.0%
]
16.60%
47695.6%
[
17.0%
-
17.5%
]
17.10%
69093.5%
[
17.5%
-
18.0%
]
17.78%
47892.5%
[
18.0%
-
18.5%
]
18.08%
1,02368.2%
[
19.5%
-
20.0%
]
19.85%
1,35589.0%
[
20.5%
-
21.0%
]
21.00%
581100.0%
[
21.5%
-
22.0%
]
21.69%
16691.4%
[
22.0%
-
22.5%
]
22.16%
388100.0%
[
23.0%
-
23.5%
]
23.42%
222100.0%
[
23.5%
-
24.0%
]
23.67%
300100.0%
[
25.0%
-
25.5%
]
25.46%
491100.0%
[
25.5%
-
26.0%
]
25.65%
38284.8%
[
27.0%
-
27.5%
]
27.50%
40100.0%
[
30.0%
-
30.5%
]
30.43%
46100.0%
[
30.5%
-
31.0%
]
30.60%
97470.4%
[
31.0%
-
31.5%
]
31.13%
257100.0%
[
32.0%
-
32.5%
]
32.26%
15596.7%
[
33.0%
-
33.5%
]
33.14%
1,53685.7%
[
34.0%
-
34.5%
]
34.38%
6478.7%
[
35.5%
-
36.0%
]
35.59%
281100.0%
[
36.5%
-
37.0%
]
36.67%
30100.0%
[
47.0%
-
47.5%
]
47.43%
409100.0%
[
66.5%
-
67.0%
]
66.67%
42100.0%
[
88.5%
-
89.0%
]
88.89%
27100.0%