Ukrainian Self-Care Disability

COMPARE

Ukrainian
Race
Ancestry
AfghanAfricanAlaska NativeAlaskan AthabascanAlbanianAleutAlsatianAmericanApacheArabArapahoArgentineanArmenianAssyrian/Chaldean/SyriacAustralianAustrianBahamianBangladeshiBarbadianBasqueBelgianBelizeanBermudanBhutaneseBlackfeetBolivianBrazilianBritishBritish West IndianBulgarianBurmeseCajunCambodianCanadianCape VerdeanCarpatho RusynCelticCentral AmericanCentral American IndianCherokeeCheyenneChickasawChileanChineseChippewaChoctawColombianColvilleComancheCosta RicanCreeCreekCroatianCrowCubanCypriotCzechCzechoslovakianDanishDelawareDominicanDutchDutch West IndianEastern EuropeanEcuadorianEgyptianEnglishEstonianEthiopianEuropeanFijianFilipinoFinnishFrenchFrench American IndianFrench CanadianGermanGerman RussianGhanaianGreekGuamanian/ChamorroGuatemalanGuyaneseHaitianHmongHonduranHopiHoumaHungarianIcelanderIndian (Asian)IndonesianInupiatIranianIraqiIrishIroquoisIsraeliItalianJamaicanJapaneseJordanianKenyanKiowaKoreanLaotianLatvianLebaneseLiberianLithuanianLumbeeLuxembourgerMacedonianMalaysianMalteseMarshalleseMenomineeMexicanMexican American IndianMongolianMoroccanNative HawaiianNavajoNepaleseNew ZealanderNicaraguanNigerianNorthern EuropeanNorwegianOkinawanOsageOttawaPaiutePakistaniPalestinianPanamanianParaguayanPennsylvania GermanPeruvianPimaPolishPortuguesePotawatomiPuebloPuerto RicanPuget Sound SalishRomanianRussianSalvadoranSamoanScandinavianScotch-IrishScottishSeminoleSenegaleseSerbianShoshoneSierra LeoneanSiouxSlavicSlovakSloveneSomaliSouth AfricanSouth AmericanSouth American IndianSoviet UnionSpaniardSpanishSpanish AmericanSpanish American IndianSri LankanSubsaharan AfricanSudaneseSwedishSwissSyrianTaiwaneseThaiTlingit-HaidaTohono O'OdhamTonganTrinidadian and TobagonianTsimshianTurkishU.S. Virgin IslanderUgandanUkrainianUruguayanUteVenezuelanVietnameseWelshWest IndianYakamaYaquiYugoslavianYumanYup'ikZimbabwean
Immigration
NonimmigrantsImmigrantsAfghanistanAfricaAlbaniaArgentinaArmeniaAsiaAustraliaAustriaBahamasBangladeshBarbadosBelarusBelgiumBelizeBoliviaBosnia and HerzegovinaBrazilBulgariaBurma/MyanmarCabo VerdeCambodiaCameroonCanadaCaribbeanCentral AmericaChileChinaColombiaCongoCosta RicaCroatiaCubaCzechoslovakiaDenmarkDominicaDominican RepublicEastern AfricaEastern AsiaEastern EuropeEcuadorEgyptEl SalvadorEnglandEritreaEthiopiaEuropeFijiFranceGermanyGhanaGreeceGrenadaGuatemalaGuyanaHaitiHondurasHong KongHungaryIndiaIndonesiaIranIraqIrelandIsraelItalyJamaicaJapanJordanKazakhstanKenyaKoreaKuwaitLaosLatin AmericaLatviaLebanonLiberiaLithuaniaMalaysiaMexicoMicronesiaMiddle AfricaMoldovaMoroccoNepalNetherlandsNicaraguaNigeriaNorth AmericaNorth MacedoniaNorthern AfricaNorthern EuropeNorwayOceaniaPakistanPanamaPeruPhilippinesPolandPortugalRomaniaRussiaSaudi ArabiaScotlandSenegalSerbiaSierra LeoneSingaporeSomaliaSouth AfricaSouth AmericaSouth Central AsiaSouth Eastern AsiaSouthern EuropeSpainSri LankaSt. Vincent and the GrenadinesSudanSwedenSwitzerlandSyriaTaiwanThailandTrinidad and TobagoTurkeyUgandaUkraineUruguayUzbekistanVenezuelaVietnamWest IndiesWestern AfricaWestern AsiaWestern EuropeYemenZaireZimbabweAzores
Select to Compare
Race
Ancestry
AfghanAfricanAlaska NativeAlaskan AthabascanAlbanianAleutAlsatianAmericanApacheArabArapahoArgentineanArmenianAssyrian/Chaldean/SyriacAustralianAustrianBahamianBangladeshiBarbadianBasqueBelgianBelizeanBermudanBhutaneseBlackfeetBolivianBrazilianBritishBritish West IndianBulgarianBurmeseCajunCambodianCanadianCape VerdeanCarpatho RusynCelticCentral AmericanCentral American IndianCherokeeCheyenneChickasawChileanChineseChippewaChoctawColombianColvilleComancheCosta RicanCreeCreekCroatianCrowCubanCypriotCzechCzechoslovakianDanishDelawareDominicanDutchDutch West IndianEastern EuropeanEcuadorianEgyptianEnglishEstonianEthiopianEuropeanFijianFilipinoFinnishFrenchFrench American IndianFrench CanadianGermanGerman RussianGhanaianGreekGuamanian/ChamorroGuatemalanGuyaneseHaitianHmongHonduranHopiHoumaHungarianIcelanderIndian (Asian)IndonesianInupiatIranianIraqiIrishIroquoisIsraeliItalianJamaicanJapaneseJordanianKenyanKiowaKoreanLaotianLatvianLebaneseLiberianLithuanianLumbeeLuxembourgerMacedonianMalaysianMalteseMarshalleseMenomineeMexicanMexican American IndianMongolianMoroccanNative HawaiianNavajoNepaleseNew ZealanderNicaraguanNigerianNorthern EuropeanNorwegianOkinawanOsageOttawaPaiutePakistaniPalestinianPanamanianParaguayanPennsylvania GermanPeruvianPimaPolishPortuguesePotawatomiPuebloPuerto RicanPuget Sound SalishRomanianRussianSalvadoranSamoanScandinavianScotch-IrishScottishSeminoleSenegaleseSerbianShoshoneSierra LeoneanSiouxSlavicSlovakSloveneSomaliSouth AfricanSouth AmericanSouth American IndianSoviet UnionSpaniardSpanishSpanish AmericanSpanish American IndianSri LankanSubsaharan AfricanSudaneseSwedishSwissSyrianTaiwaneseThaiTlingit-HaidaTohono O'OdhamTonganTrinidadian and TobagonianTsimshianTurkishU.S. Virgin IslanderUgandanUruguayanUteVenezuelanVietnameseWelshWest IndianYakamaYaquiYugoslavianYumanYup'ikZimbabwean
Immigration
NonimmigrantsImmigrantsAfghanistanAfricaAlbaniaArgentinaArmeniaAsiaAustraliaAustriaBahamasBangladeshBarbadosBelarusBelgiumBelizeBoliviaBosnia and HerzegovinaBrazilBulgariaBurma/MyanmarCabo VerdeCambodiaCameroonCanadaCaribbeanCentral AmericaChileChinaColombiaCongoCosta RicaCroatiaCubaCzechoslovakiaDenmarkDominicaDominican RepublicEastern AfricaEastern AsiaEastern EuropeEcuadorEgyptEl SalvadorEnglandEritreaEthiopiaEuropeFijiFranceGermanyGhanaGreeceGrenadaGuatemalaGuyanaHaitiHondurasHong KongHungaryIndiaIndonesiaIranIraqIrelandIsraelItalyJamaicaJapanJordanKazakhstanKenyaKoreaKuwaitLaosLatin AmericaLatviaLebanonLiberiaLithuaniaMalaysiaMexicoMicronesiaMiddle AfricaMoldovaMoroccoNepalNetherlandsNicaraguaNigeriaNorth AmericaNorth MacedoniaNorthern AfricaNorthern EuropeNorwayOceaniaPakistanPanamaPeruPhilippinesPolandPortugalRomaniaRussiaSaudi ArabiaScotlandSenegalSerbiaSierra LeoneSingaporeSomaliaSouth AfricaSouth AmericaSouth Central AsiaSouth Eastern AsiaSouthern EuropeSpainSri LankaSt. Vincent and the GrenadinesSudanSwedenSwitzerlandSyriaTaiwanThailandTrinidad and TobagoTurkeyUgandaUkraineUruguayUzbekistanVenezuelaVietnamWest IndiesWestern AfricaWestern AsiaWestern EuropeYemenZaireZimbabweAzores
Self-Care Disability
Income
Poverty
Unemployment
Labor Participation
Family Structure
Vehicle Availability
Education Level
Disability

Ukrainian Self-Care Disability
Fair

2.5%
SELF-CARE DISABILITY
21.4/ 100
METRIC RATING
193rd/ 347
METRIC RANK

Ukrainian Self-Care Disability Correlation Chart

The statistical analysis conducted on geographies consisting of 447,906,196 people shows a moderate positive correlation between the proportion of Ukrainians and percentage of population with self-care disability in the United States with a correlation coefficient (R) of 0.478 and weighted average of 2.5%. On average, for every 1% (one percent) increase in Ukrainians within a typical geography, there is an increase of 0.16% in percentage of population with self-care disability.
Ukrainian Self-Care Disability
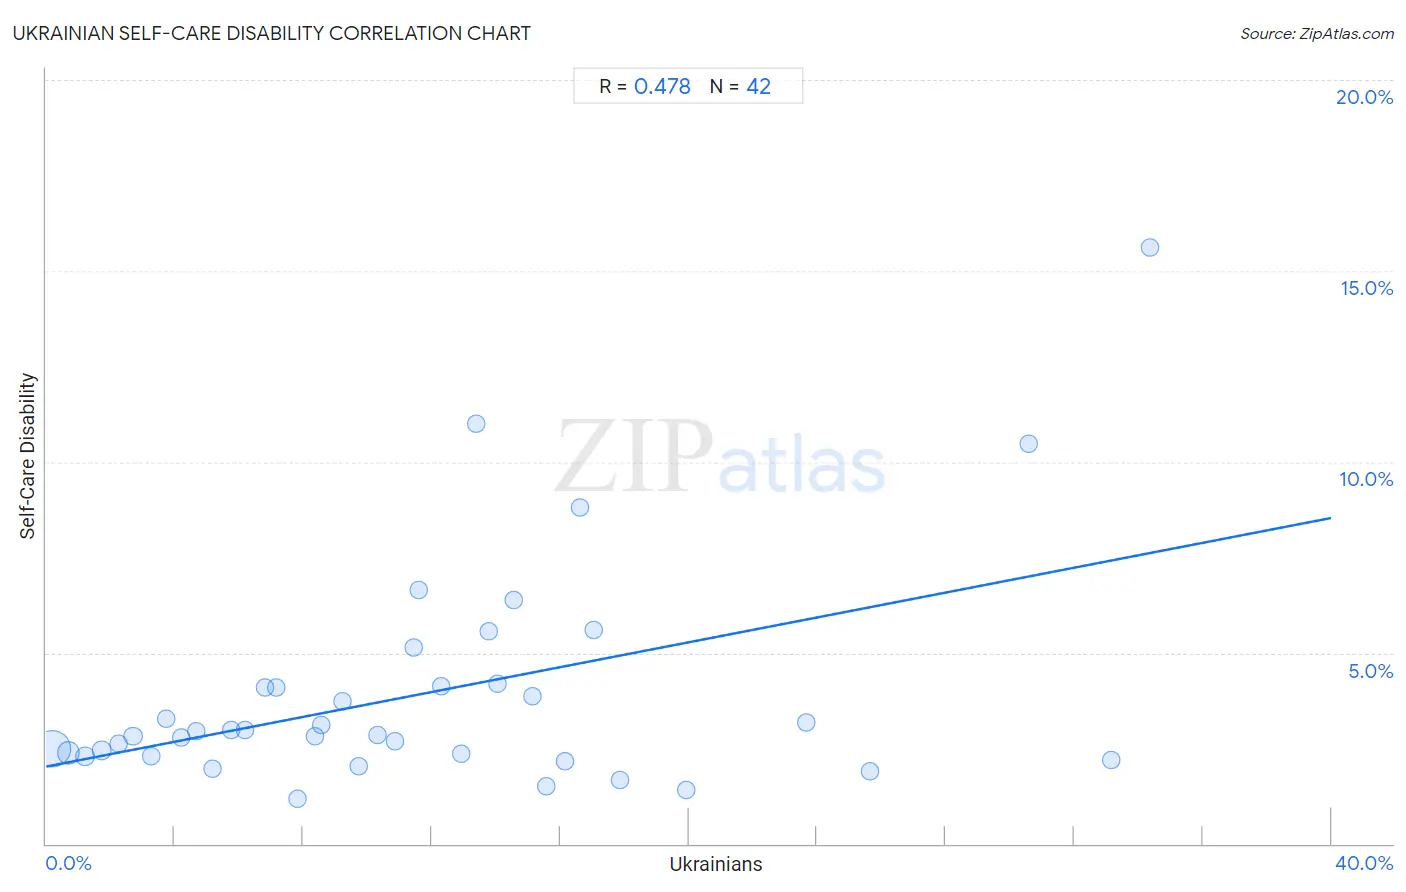
It is essential to understand that the correlation between the percentage of Ukrainians and percentage of population with self-care disability does not imply a direct cause-and-effect relationship. It remains uncertain whether the presence of Ukrainians influences an upward or downward trend in the level of percentage of population with self-care disability within an area, or if Ukrainians simply ended up residing in those areas with higher or lower levels of percentage of population with self-care disability due to other factors.

Demographics Similar to Ukrainians by Self-Care Disability

In terms of self-care disability, the demographic groups most similar to Ukrainians are Soviet Union (2.5%, a difference of 0.060%), Moroccan (2.5%, a difference of 0.11%), Sioux (2.5%, a difference of 0.22%), Immigrants from Germany (2.5%, a difference of 0.26%), and Immigrants from Eastern Europe (2.5%, a difference of 0.42%).
DemographicsRating | RankSelf-Care Disability
Immigrants from El Salvador
33.0
/100
|
#186
Fair
2.5%
Irish
28.7
/100
|
#187
Fair
2.5%
Immigrants from Oceania
28.3
/100
|
#188
Fair
2.5%
Immigrants from Eastern Europe
28.0
/100
|
#189
Fair
2.5%
Sioux
24.6
/100
|
#190
Fair
2.5%
Moroccans
22.9
/100
|
#191
Fair
2.5%
Soviet Union
22.2
/100
|
#192
Fair
2.5%
Ukrainians
21.4
/100
|
#193
Fair
2.5%
Immigrants from Germany
17.9
/100
|
#194
Poor
2.5%
Immigrants from Southern Europe
15.6
/100
|
#195
Poor
2.5%
Koreans
15.5
/100
|
#196
Poor
2.5%
Crow
15.2
/100
|
#197
Poor
2.5%
Immigrants
15.0
/100
|
#198
Poor
2.5%
Immigrants from Ghana
14.7
/100
|
#199
Poor
2.5%
Immigrants from Western Africa
13.3
/100
|
#200
Poor
2.5%

Ukrainian Self-Care Disability Correlation Summary

MeasurementUkrainian DataSelf-Care Disability Data
Minimum0.19%1.2%
Maximum34.4%15.6%
Range34.2%14.4%
Mean11.7%3.9%
Median10.6%2.9%
Interquartile 25% (IQ1)5.2%2.3%
Interquartile 75% (IQ3)15.6%4.1%
Interquartile Range (IQR)10.4%1.8%
Standard Deviation (Sample)8.5%2.9%
Standard Deviation (Population)8.4%2.9%

Correlation Details

Ukrainian PercentileSample SizeSelf-Care Disability
[
0.0%
-
0.5%
]
0.19%
334,421,2242.5%
[
0.5%
-
1.0%
]
0.70%
77,991,2062.4%
[
1.0%
-
1.5%
]
1.19%
19,066,4122.3%
[
1.5%
-
2.0%
]
1.73%
7,935,5892.4%
[
2.0%
-
2.5%
]
2.24%
2,889,0312.6%
[
2.5%
-
3.0%
]
2.70%
2,312,8562.8%
[
3.0%
-
3.5%
]
3.25%
685,4482.3%
[
3.5%
-
4.0%
]
3.73%
794,7683.3%
[
4.0%
-
4.5%
]
4.19%
373,9122.8%
[
4.5%
-
5.0%
]
4.68%
381,4852.9%
[
5.0%
-
5.5%
]
5.19%
139,2452.0%
[
5.5%
-
6.0%
]
5.76%
303,3133.0%
[
6.0%
-
6.5%
]
6.21%
144,3133.0%
[
6.5%
-
7.0%
]
6.82%
103,1914.1%
[
7.0%
-
7.5%
]
7.17%
72,8184.1%
[
7.5%
-
8.0%
]
7.83%
7,0381.2%
[
8.0%
-
8.5%
]
8.37%
87,2762.8%
[
8.5%
-
9.0%
]
8.56%
56,9633.1%
[
9.0%
-
9.5%
]
9.23%
12,6033.7%
[
9.5%
-
10.0%
]
9.71%
11,4412.0%
[
10.0%
-
10.5%
]
10.30%
6,8822.8%
[
10.5%
-
11.0%
]
10.87%
2,8062.7%
[
11.0%
-
11.5%
]
11.44%
3765.1%
[
11.5%
-
12.0%
]
11.60%
85,4996.6%
[
12.0%
-
12.5%
]
12.29%
1,7664.1%
[
12.5%
-
13.0%
]
12.94%
1,7782.4%
[
13.0%
-
13.5%
]
13.38%
3,56611.0%
[
13.5%
-
14.0%
]
13.78%
3125.6%
[
14.0%
-
14.5%
]
14.05%
1,8364.2%
[
14.5%
-
15.0%
]
14.56%
1,1956.4%
[
15.0%
-
15.5%
]
15.13%
9983.9%
[
15.5%
-
16.0%
]
15.56%
9001.5%
[
16.0%
-
16.5%
]
16.17%
3,0312.2%
[
16.5%
-
17.0%
]
16.60%
4768.8%
[
17.0%
-
17.5%
]
17.06%
5985.6%
[
17.5%
-
18.0%
]
17.85%
2971.7%
[
19.5%
-
20.0%
]
19.92%
4921.4%
[
23.5%
-
24.0%
]
23.67%
3003.2%
[
25.5%
-
26.0%
]
25.65%
3821.9%
[
30.5%
-
31.0%
]
30.60%
97410.5%
[
33.0%
-
33.5%
]
33.14%
1,5362.2%
[
34.0%
-
34.5%
]
34.38%
6415.6%