Laotian Married-Couple Family Poverty

COMPARE

Laotian
Race
Ancestry
AfghanAfricanAlaska NativeAlaskan AthabascanAlbanianAleutAlsatianAmericanApacheArabArapahoArgentineanArmenianAssyrian/Chaldean/SyriacAustralianAustrianBahamianBangladeshiBarbadianBasqueBelgianBelizeanBermudanBhutaneseBlackfeetBolivianBrazilianBritishBritish West IndianBulgarianBurmeseCajunCambodianCanadianCape VerdeanCarpatho RusynCelticCentral AmericanCentral American IndianCherokeeCheyenneChickasawChileanChineseChippewaChoctawColombianColvilleComancheCosta RicanCreeCreekCroatianCrowCubanCypriotCzechCzechoslovakianDanishDelawareDominicanDutchDutch West IndianEastern EuropeanEcuadorianEgyptianEnglishEstonianEthiopianEuropeanFijianFilipinoFinnishFrenchFrench American IndianFrench CanadianGermanGerman RussianGhanaianGreekGuamanian/ChamorroGuatemalanGuyaneseHaitianHmongHonduranHopiHoumaHungarianIcelanderIndian (Asian)IndonesianInupiatIranianIraqiIrishIroquoisIsraeliItalianJamaicanJapaneseJordanianKenyanKiowaKoreanLaotianLatvianLebaneseLiberianLithuanianLumbeeLuxembourgerMacedonianMalaysianMalteseMarshalleseMenomineeMexicanMexican American IndianMongolianMoroccanNative HawaiianNavajoNepaleseNew ZealanderNicaraguanNigerianNorthern EuropeanNorwegianOkinawanOsageOttawaPaiutePakistaniPalestinianPanamanianParaguayanPennsylvania GermanPeruvianPimaPolishPortuguesePotawatomiPuebloPuerto RicanPuget Sound SalishRomanianRussianSalvadoranSamoanScandinavianScotch-IrishScottishSeminoleSenegaleseSerbianShoshoneSierra LeoneanSiouxSlavicSlovakSloveneSomaliSouth AfricanSouth AmericanSouth American IndianSoviet UnionSpaniardSpanishSpanish AmericanSpanish American IndianSri LankanSubsaharan AfricanSudaneseSwedishSwissSyrianTaiwaneseThaiTlingit-HaidaTohono O'OdhamTonganTrinidadian and TobagonianTsimshianTurkishU.S. Virgin IslanderUgandanUkrainianUruguayanUteVenezuelanVietnameseWelshWest IndianYakamaYaquiYugoslavianYumanYup'ikZimbabwean
Immigration
NonimmigrantsImmigrantsAfghanistanAfricaAlbaniaArgentinaArmeniaAsiaAustraliaAustriaBahamasBangladeshBarbadosBelarusBelgiumBelizeBoliviaBosnia and HerzegovinaBrazilBulgariaBurma/MyanmarCabo VerdeCambodiaCameroonCanadaCaribbeanCentral AmericaChileChinaColombiaCongoCosta RicaCroatiaCubaCzechoslovakiaDenmarkDominicaDominican RepublicEastern AfricaEastern AsiaEastern EuropeEcuadorEgyptEl SalvadorEnglandEritreaEthiopiaEuropeFijiFranceGermanyGhanaGreeceGrenadaGuatemalaGuyanaHaitiHondurasHong KongHungaryIndiaIndonesiaIranIraqIrelandIsraelItalyJamaicaJapanJordanKazakhstanKenyaKoreaKuwaitLaosLatin AmericaLatviaLebanonLiberiaLithuaniaMalaysiaMexicoMicronesiaMiddle AfricaMoldovaMoroccoNepalNetherlandsNicaraguaNigeriaNorth AmericaNorth MacedoniaNorthern AfricaNorthern EuropeNorwayOceaniaPakistanPanamaPeruPhilippinesPolandPortugalRomaniaRussiaSaudi ArabiaScotlandSenegalSerbiaSierra LeoneSingaporeSomaliaSouth AfricaSouth AmericaSouth Central AsiaSouth Eastern AsiaSouthern EuropeSpainSri LankaSt. Vincent and the GrenadinesSudanSwedenSwitzerlandSyriaTaiwanThailandTrinidad and TobagoTurkeyUgandaUkraineUruguayUzbekistanVenezuelaVietnamWest IndiesWestern AfricaWestern AsiaWestern EuropeYemenZaireZimbabweAzores
Select to Compare
Race
Ancestry
AfghanAfricanAlaska NativeAlaskan AthabascanAlbanianAleutAlsatianAmericanApacheArabArapahoArgentineanArmenianAssyrian/Chaldean/SyriacAustralianAustrianBahamianBangladeshiBarbadianBasqueBelgianBelizeanBermudanBhutaneseBlackfeetBolivianBrazilianBritishBritish West IndianBulgarianBurmeseCajunCambodianCanadianCape VerdeanCarpatho RusynCelticCentral AmericanCentral American IndianCherokeeCheyenneChickasawChileanChineseChippewaChoctawColombianColvilleComancheCosta RicanCreeCreekCroatianCrowCubanCypriotCzechCzechoslovakianDanishDelawareDominicanDutchDutch West IndianEastern EuropeanEcuadorianEgyptianEnglishEstonianEthiopianEuropeanFijianFilipinoFinnishFrenchFrench American IndianFrench CanadianGermanGerman RussianGhanaianGreekGuamanian/ChamorroGuatemalanGuyaneseHaitianHmongHonduranHopiHoumaHungarianIcelanderIndian (Asian)IndonesianInupiatIranianIraqiIrishIroquoisIsraeliItalianJamaicanJapaneseJordanianKenyanKiowaKoreanLatvianLebaneseLiberianLithuanianLumbeeLuxembourgerMacedonianMalaysianMalteseMarshalleseMenomineeMexicanMexican American IndianMongolianMoroccanNative HawaiianNavajoNepaleseNew ZealanderNicaraguanNigerianNorthern EuropeanNorwegianOkinawanOsageOttawaPaiutePakistaniPalestinianPanamanianParaguayanPennsylvania GermanPeruvianPimaPolishPortuguesePotawatomiPuebloPuerto RicanPuget Sound SalishRomanianRussianSalvadoranSamoanScandinavianScotch-IrishScottishSeminoleSenegaleseSerbianShoshoneSierra LeoneanSiouxSlavicSlovakSloveneSomaliSouth AfricanSouth AmericanSouth American IndianSoviet UnionSpaniardSpanishSpanish AmericanSpanish American IndianSri LankanSubsaharan AfricanSudaneseSwedishSwissSyrianTaiwaneseThaiTlingit-HaidaTohono O'OdhamTonganTrinidadian and TobagonianTsimshianTurkishU.S. Virgin IslanderUgandanUkrainianUruguayanUteVenezuelanVietnameseWelshWest IndianYakamaYaquiYugoslavianYumanYup'ikZimbabwean
Immigration
NonimmigrantsImmigrantsAfghanistanAfricaAlbaniaArgentinaArmeniaAsiaAustraliaAustriaBahamasBangladeshBarbadosBelarusBelgiumBelizeBoliviaBosnia and HerzegovinaBrazilBulgariaBurma/MyanmarCabo VerdeCambodiaCameroonCanadaCaribbeanCentral AmericaChileChinaColombiaCongoCosta RicaCroatiaCubaCzechoslovakiaDenmarkDominicaDominican RepublicEastern AfricaEastern AsiaEastern EuropeEcuadorEgyptEl SalvadorEnglandEritreaEthiopiaEuropeFijiFranceGermanyGhanaGreeceGrenadaGuatemalaGuyanaHaitiHondurasHong KongHungaryIndiaIndonesiaIranIraqIrelandIsraelItalyJamaicaJapanJordanKazakhstanKenyaKoreaKuwaitLaosLatin AmericaLatviaLebanonLiberiaLithuaniaMalaysiaMexicoMicronesiaMiddle AfricaMoldovaMoroccoNepalNetherlandsNicaraguaNigeriaNorth AmericaNorth MacedoniaNorthern AfricaNorthern EuropeNorwayOceaniaPakistanPanamaPeruPhilippinesPolandPortugalRomaniaRussiaSaudi ArabiaScotlandSenegalSerbiaSierra LeoneSingaporeSomaliaSouth AfricaSouth AmericaSouth Central AsiaSouth Eastern AsiaSouthern EuropeSpainSri LankaSt. Vincent and the GrenadinesSudanSwedenSwitzerlandSyriaTaiwanThailandTrinidad and TobagoTurkeyUgandaUkraineUruguayUzbekistanVenezuelaVietnamWest IndiesWestern AfricaWestern AsiaWestern EuropeYemenZaireZimbabweAzores
Married-Couple Family Poverty
Income
Poverty
Unemployment
Labor Participation
Family Structure
Vehicle Availability
Education Level
Disability

Laotian Married-Couple Family Poverty
Exceptional

4.7%
POVERTY | MARRIED-COUPLE FAMILIES
96.6/ 100
METRIC RATING
108th/ 347
METRIC RANK

Laotian Married-Couple Family Poverty Correlation Chart

The statistical analysis conducted on geographies consisting of 223,838,659 people shows a moderate positive correlation between the proportion of Laotians and poverty level among married-couple families in the United States with a correlation coefficient (R) of 0.421 and weighted average of 4.7%. On average, for every 1% (one percent) increase in Laotians within a typical geography, there is an increase of 0.48% in poverty level among married-couple families.
Laotian Married-Couple Family Poverty
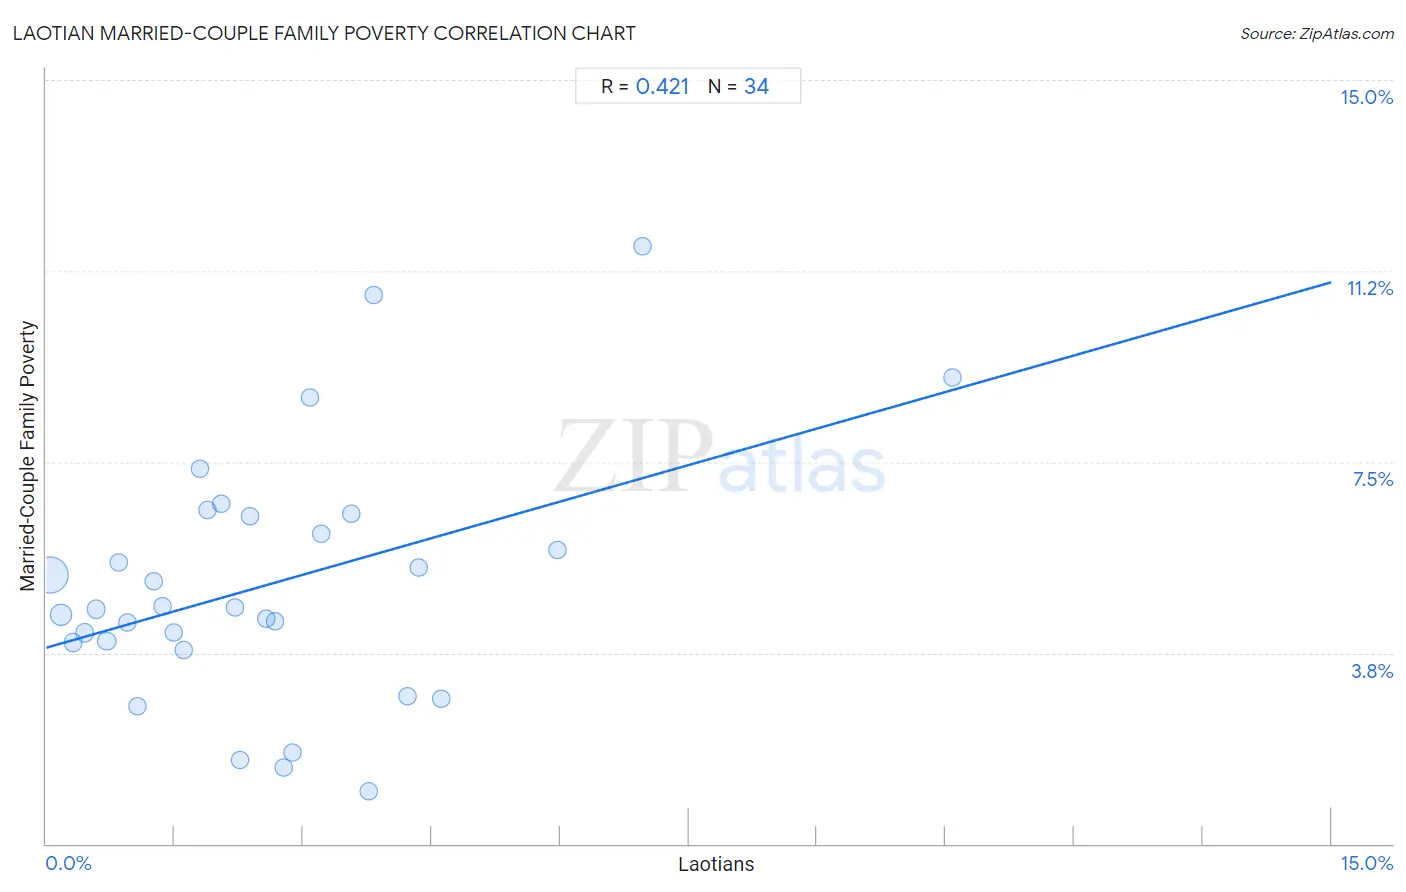
It is essential to understand that the correlation between the percentage of Laotians and poverty level among married-couple families does not imply a direct cause-and-effect relationship. It remains uncertain whether the presence of Laotians influences an upward or downward trend in the level of poverty level among married-couple families within an area, or if Laotians simply ended up residing in those areas with higher or lower levels of poverty level among married-couple families due to other factors.

Demographics Similar to Laotians by Married-Couple Family Poverty

In terms of married-couple family poverty, the demographic groups most similar to Laotians are Immigrants from Hong Kong (4.7%, a difference of 0.20%), Immigrants from Germany (4.7%, a difference of 0.26%), Immigrants from France (4.7%, a difference of 0.27%), Immigrants from Bolivia (4.7%, a difference of 0.36%), and Pakistani (4.7%, a difference of 0.40%).
DemographicsRating | RankMarried-Couple Family Poverty
Yugoslavians
97.8
/100
|
#101
Exceptional
4.6%
Asians
97.6
/100
|
#102
Exceptional
4.7%
Immigrants from Romania
97.3
/100
|
#103
Exceptional
4.7%
Immigrants from Moldova
97.1
/100
|
#104
Exceptional
4.7%
Aleuts
97.0
/100
|
#105
Exceptional
4.7%
Immigrants from France
96.9
/100
|
#106
Exceptional
4.7%
Immigrants from Germany
96.8
/100
|
#107
Exceptional
4.7%
Laotians
96.6
/100
|
#108
Exceptional
4.7%
Immigrants from Hong Kong
96.4
/100
|
#109
Exceptional
4.7%
Immigrants from Bolivia
96.2
/100
|
#110
Exceptional
4.7%
Pakistanis
96.2
/100
|
#111
Exceptional
4.7%
Tongans
95.9
/100
|
#112
Exceptional
4.7%
Immigrants from Nepal
95.9
/100
|
#113
Exceptional
4.7%
Immigrants from Indonesia
95.1
/100
|
#114
Exceptional
4.8%
Taiwanese
94.8
/100
|
#115
Exceptional
4.8%

Laotian Married-Couple Family Poverty Correlation Summary

MeasurementLaotian DataMarried-Couple Family Poverty Data
Minimum0.051%1.0%
Maximum10.6%11.7%
Range10.5%10.7%
Mean2.6%5.1%
Median2.2%4.6%
Interquartile 25% (IQ1)1.1%4.0%
Interquartile 75% (IQ3)3.6%6.4%
Interquartile Range (IQR)2.5%2.5%
Standard Deviation (Sample)2.2%2.5%
Standard Deviation (Population)2.1%2.4%

Correlation Details

Laotian PercentileSample SizeMarried-Couple Family Poverty
[
0.0%
-
0.5%
]
0.051%
165,247,4455.3%
[
0.0%
-
0.5%
]
0.18%
36,184,9054.5%
[
0.0%
-
0.5%
]
0.31%
10,077,2444.0%
[
0.0%
-
0.5%
]
0.45%
5,411,5594.1%
[
0.5%
-
1.0%
]
0.59%
2,183,0654.6%
[
0.5%
-
1.0%
]
0.71%
1,999,6074.0%
[
0.5%
-
1.0%
]
0.85%
804,2575.5%
[
0.5%
-
1.0%
]
0.94%
600,7624.3%
[
1.0%
-
1.5%
]
1.07%
152,8282.7%
[
1.0%
-
1.5%
]
1.26%
208,7915.2%
[
1.0%
-
1.5%
]
1.36%
150,4964.7%
[
1.0%
-
1.5%
]
1.49%
149,9434.2%
[
1.5%
-
2.0%
]
1.61%
18,1843.8%
[
1.5%
-
2.0%
]
1.79%
231,3417.4%
[
1.5%
-
2.0%
]
1.88%
42,5906.6%
[
2.0%
-
2.5%
]
2.05%
112,4746.7%
[
2.0%
-
2.5%
]
2.20%
57,5784.6%
[
2.0%
-
2.5%
]
2.27%
36,3681.6%
[
2.0%
-
2.5%
]
2.39%
19,0316.4%
[
2.5%
-
3.0%
]
2.57%
6,9374.4%
[
2.5%
-
3.0%
]
2.67%
11,7394.4%
[
2.5%
-
3.0%
]
2.77%
51,7201.5%
[
2.5%
-
3.0%
]
2.88%
2431.8%
[
3.0%
-
3.5%
]
3.07%
6,2498.8%
[
3.0%
-
3.5%
]
3.21%
2,2156.1%
[
3.5%
-
4.0%
]
3.56%
12,4786.5%
[
3.5%
-
4.0%
]
3.76%
1,3041.0%
[
3.5%
-
4.0%
]
3.82%
89010.8%
[
4.0%
-
4.5%
]
4.22%
1,1382.9%
[
4.0%
-
4.5%
]
4.35%
26,5565.4%
[
4.5%
-
5.0%
]
4.61%
1,6922.8%
[
5.5%
-
6.0%
]
5.97%
23,0545.8%
[
6.5%
-
7.0%
]
6.97%
2,75611.7%
[
10.5%
-
11.0%
]
10.57%
1,2209.2%