Laotian Self-Care Disability

COMPARE

Laotian
Race
Ancestry
AfghanAfricanAlaska NativeAlaskan AthabascanAlbanianAleutAlsatianAmericanApacheArabArapahoArgentineanArmenianAssyrian/Chaldean/SyriacAustralianAustrianBahamianBangladeshiBarbadianBasqueBelgianBelizeanBermudanBhutaneseBlackfeetBolivianBrazilianBritishBritish West IndianBulgarianBurmeseCajunCambodianCanadianCape VerdeanCarpatho RusynCelticCentral AmericanCentral American IndianCherokeeCheyenneChickasawChileanChineseChippewaChoctawColombianColvilleComancheCosta RicanCreeCreekCroatianCrowCubanCypriotCzechCzechoslovakianDanishDelawareDominicanDutchDutch West IndianEastern EuropeanEcuadorianEgyptianEnglishEstonianEthiopianEuropeanFijianFilipinoFinnishFrenchFrench American IndianFrench CanadianGermanGerman RussianGhanaianGreekGuamanian/ChamorroGuatemalanGuyaneseHaitianHmongHonduranHopiHoumaHungarianIcelanderIndian (Asian)IndonesianInupiatIranianIraqiIrishIroquoisIsraeliItalianJamaicanJapaneseJordanianKenyanKiowaKoreanLaotianLatvianLebaneseLiberianLithuanianLumbeeLuxembourgerMacedonianMalaysianMalteseMarshalleseMenomineeMexicanMexican American IndianMongolianMoroccanNative HawaiianNavajoNepaleseNew ZealanderNicaraguanNigerianNorthern EuropeanNorwegianOkinawanOsageOttawaPaiutePakistaniPalestinianPanamanianParaguayanPennsylvania GermanPeruvianPimaPolishPortuguesePotawatomiPuebloPuerto RicanPuget Sound SalishRomanianRussianSalvadoranSamoanScandinavianScotch-IrishScottishSeminoleSenegaleseSerbianShoshoneSierra LeoneanSiouxSlavicSlovakSloveneSomaliSouth AfricanSouth AmericanSouth American IndianSoviet UnionSpaniardSpanishSpanish AmericanSpanish American IndianSri LankanSubsaharan AfricanSudaneseSwedishSwissSyrianTaiwaneseThaiTlingit-HaidaTohono O'OdhamTonganTrinidadian and TobagonianTsimshianTurkishU.S. Virgin IslanderUgandanUkrainianUruguayanUteVenezuelanVietnameseWelshWest IndianYakamaYaquiYugoslavianYumanYup'ikZimbabwean
Immigration
NonimmigrantsImmigrantsAfghanistanAfricaAlbaniaArgentinaArmeniaAsiaAustraliaAustriaBahamasBangladeshBarbadosBelarusBelgiumBelizeBoliviaBosnia and HerzegovinaBrazilBulgariaBurma/MyanmarCabo VerdeCambodiaCameroonCanadaCaribbeanCentral AmericaChileChinaColombiaCongoCosta RicaCroatiaCubaCzechoslovakiaDenmarkDominicaDominican RepublicEastern AfricaEastern AsiaEastern EuropeEcuadorEgyptEl SalvadorEnglandEritreaEthiopiaEuropeFijiFranceGermanyGhanaGreeceGrenadaGuatemalaGuyanaHaitiHondurasHong KongHungaryIndiaIndonesiaIranIraqIrelandIsraelItalyJamaicaJapanJordanKazakhstanKenyaKoreaKuwaitLaosLatin AmericaLatviaLebanonLiberiaLithuaniaMalaysiaMexicoMicronesiaMiddle AfricaMoldovaMoroccoNepalNetherlandsNicaraguaNigeriaNorth AmericaNorth MacedoniaNorthern AfricaNorthern EuropeNorwayOceaniaPakistanPanamaPeruPhilippinesPolandPortugalRomaniaRussiaSaudi ArabiaScotlandSenegalSerbiaSierra LeoneSingaporeSomaliaSouth AfricaSouth AmericaSouth Central AsiaSouth Eastern AsiaSouthern EuropeSpainSri LankaSt. Vincent and the GrenadinesSudanSwedenSwitzerlandSyriaTaiwanThailandTrinidad and TobagoTurkeyUgandaUkraineUruguayUzbekistanVenezuelaVietnamWest IndiesWestern AfricaWestern AsiaWestern EuropeYemenZaireZimbabweAzores
Select to Compare
Race
Ancestry
AfghanAfricanAlaska NativeAlaskan AthabascanAlbanianAleutAlsatianAmericanApacheArabArapahoArgentineanArmenianAssyrian/Chaldean/SyriacAustralianAustrianBahamianBangladeshiBarbadianBasqueBelgianBelizeanBermudanBhutaneseBlackfeetBolivianBrazilianBritishBritish West IndianBulgarianBurmeseCajunCambodianCanadianCape VerdeanCarpatho RusynCelticCentral AmericanCentral American IndianCherokeeCheyenneChickasawChileanChineseChippewaChoctawColombianColvilleComancheCosta RicanCreeCreekCroatianCrowCubanCypriotCzechCzechoslovakianDanishDelawareDominicanDutchDutch West IndianEastern EuropeanEcuadorianEgyptianEnglishEstonianEthiopianEuropeanFijianFilipinoFinnishFrenchFrench American IndianFrench CanadianGermanGerman RussianGhanaianGreekGuamanian/ChamorroGuatemalanGuyaneseHaitianHmongHonduranHopiHoumaHungarianIcelanderIndian (Asian)IndonesianInupiatIranianIraqiIrishIroquoisIsraeliItalianJamaicanJapaneseJordanianKenyanKiowaKoreanLatvianLebaneseLiberianLithuanianLumbeeLuxembourgerMacedonianMalaysianMalteseMarshalleseMenomineeMexicanMexican American IndianMongolianMoroccanNative HawaiianNavajoNepaleseNew ZealanderNicaraguanNigerianNorthern EuropeanNorwegianOkinawanOsageOttawaPaiutePakistaniPalestinianPanamanianParaguayanPennsylvania GermanPeruvianPimaPolishPortuguesePotawatomiPuebloPuerto RicanPuget Sound SalishRomanianRussianSalvadoranSamoanScandinavianScotch-IrishScottishSeminoleSenegaleseSerbianShoshoneSierra LeoneanSiouxSlavicSlovakSloveneSomaliSouth AfricanSouth AmericanSouth American IndianSoviet UnionSpaniardSpanishSpanish AmericanSpanish American IndianSri LankanSubsaharan AfricanSudaneseSwedishSwissSyrianTaiwaneseThaiTlingit-HaidaTohono O'OdhamTonganTrinidadian and TobagonianTsimshianTurkishU.S. Virgin IslanderUgandanUkrainianUruguayanUteVenezuelanVietnameseWelshWest IndianYakamaYaquiYugoslavianYumanYup'ikZimbabwean
Immigration
NonimmigrantsImmigrantsAfghanistanAfricaAlbaniaArgentinaArmeniaAsiaAustraliaAustriaBahamasBangladeshBarbadosBelarusBelgiumBelizeBoliviaBosnia and HerzegovinaBrazilBulgariaBurma/MyanmarCabo VerdeCambodiaCameroonCanadaCaribbeanCentral AmericaChileChinaColombiaCongoCosta RicaCroatiaCubaCzechoslovakiaDenmarkDominicaDominican RepublicEastern AfricaEastern AsiaEastern EuropeEcuadorEgyptEl SalvadorEnglandEritreaEthiopiaEuropeFijiFranceGermanyGhanaGreeceGrenadaGuatemalaGuyanaHaitiHondurasHong KongHungaryIndiaIndonesiaIranIraqIrelandIsraelItalyJamaicaJapanJordanKazakhstanKenyaKoreaKuwaitLaosLatin AmericaLatviaLebanonLiberiaLithuaniaMalaysiaMexicoMicronesiaMiddle AfricaMoldovaMoroccoNepalNetherlandsNicaraguaNigeriaNorth AmericaNorth MacedoniaNorthern AfricaNorthern EuropeNorwayOceaniaPakistanPanamaPeruPhilippinesPolandPortugalRomaniaRussiaSaudi ArabiaScotlandSenegalSerbiaSierra LeoneSingaporeSomaliaSouth AfricaSouth AmericaSouth Central AsiaSouth Eastern AsiaSouthern EuropeSpainSri LankaSt. Vincent and the GrenadinesSudanSwedenSwitzerlandSyriaTaiwanThailandTrinidad and TobagoTurkeyUgandaUkraineUruguayUzbekistanVenezuelaVietnamWest IndiesWestern AfricaWestern AsiaWestern EuropeYemenZaireZimbabweAzores
Self-Care Disability
Income
Poverty
Unemployment
Labor Participation
Family Structure
Vehicle Availability
Education Level
Disability

Laotian Self-Care Disability
Excellent

2.4%
SELF-CARE DISABILITY
87.8/ 100
METRIC RATING
135th/ 347
METRIC RANK

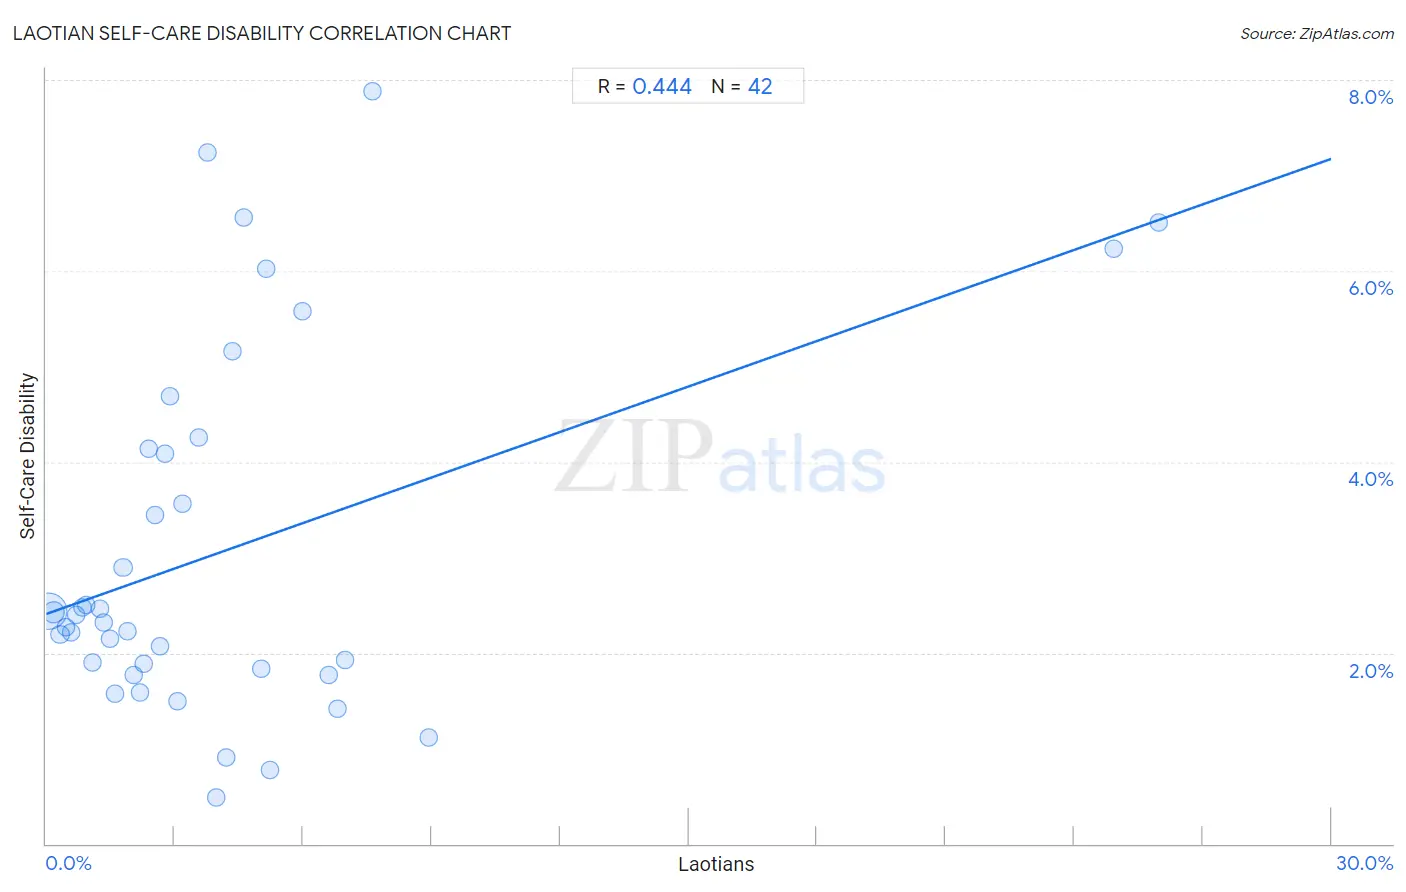
Laotian Self-Care Disability Correlation Chart

The statistical analysis conducted on geographies consisting of 224,705,626 people shows a moderate positive correlation between the proportion of Laotians and percentage of population with self-care disability in the United States with a correlation coefficient (R) of 0.444 and weighted average of 2.4%. On average, for every 1% (one percent) increase in Laotians within a typical geography, there is an increase of 0.16% in percentage of population with self-care disability.
Laotian Self-Care Disability
It is essential to understand that the correlation between the percentage of Laotians and percentage of population with self-care disability does not imply a direct cause-and-effect relationship. It remains uncertain whether the presence of Laotians influences an upward or downward trend in the level of percentage of population with self-care disability within an area, or if Laotians simply ended up residing in those areas with higher or lower levels of percentage of population with self-care disability due to other factors.

Demographics Similar to Laotians by Self-Care Disability

In terms of self-care disability, the demographic groups most similar to Laotians are Russian (2.4%, a difference of 0.050%), South American Indian (2.4%, a difference of 0.070%), Austrian (2.4%, a difference of 0.080%), Immigrants from Colombia (2.4%, a difference of 0.090%), and Immigrants from South America (2.4%, a difference of 0.12%).
DemographicsRating | RankSelf-Care Disability
Immigrants from Hungary
89.6
/100
|
#128
Excellent
2.4%
Immigrants from Romania
89.3
/100
|
#129
Excellent
2.4%
Immigrants from Austria
89.0
/100
|
#130
Excellent
2.4%
Poles
88.9
/100
|
#131
Excellent
2.4%
Immigrants from South America
88.8
/100
|
#132
Excellent
2.4%
Immigrants from Colombia
88.5
/100
|
#133
Excellent
2.4%
Russians
88.2
/100
|
#134
Excellent
2.4%
Laotians
87.8
/100
|
#135
Excellent
2.4%
South American Indians
87.2
/100
|
#136
Excellent
2.4%
Austrians
87.0
/100
|
#137
Excellent
2.4%
Immigrants from Croatia
86.6
/100
|
#138
Excellent
2.4%
Sri Lankans
86.6
/100
|
#139
Excellent
2.4%
Immigrants from Uruguay
85.4
/100
|
#140
Excellent
2.4%
Alaska Natives
84.5
/100
|
#141
Excellent
2.4%
Immigrants from Peru
83.2
/100
|
#142
Excellent
2.4%

Laotian Self-Care Disability Correlation Summary

MeasurementLaotian DataSelf-Care Disability Data
Minimum0.051%0.49%
Maximum26.0%7.9%
Range25.9%7.4%
Mean4.1%3.1%
Median2.7%2.4%
Interquartile 25% (IQ1)1.4%1.8%
Interquartile 75% (IQ3)5.0%4.1%
Interquartile Range (IQR)3.7%2.3%
Standard Deviation (Sample)5.3%1.9%
Standard Deviation (Population)5.2%1.9%

Correlation Details

Laotian PercentileSample SizeSelf-Care Disability
[
0.0%
-
0.5%
]
0.051%
165,539,6472.4%
[
0.0%
-
0.5%
]
0.18%
36,351,9052.4%
[
0.0%
-
0.5%
]
0.31%
10,226,9702.2%
[
0.0%
-
0.5%
]
0.45%
5,488,0582.3%
[
0.5%
-
1.0%
]
0.59%
2,238,8892.2%
[
0.5%
-
1.0%
]
0.71%
2,035,8082.4%
[
0.5%
-
1.0%
]
0.85%
810,5022.5%
[
0.5%
-
1.0%
]
0.94%
619,3062.5%
[
1.0%
-
1.5%
]
1.08%
173,1491.9%
[
1.0%
-
1.5%
]
1.26%
208,7912.5%
[
1.0%
-
1.5%
]
1.36%
162,6812.3%
[
1.0%
-
1.5%
]
1.49%
158,7172.1%
[
1.5%
-
2.0%
]
1.61%
18,1841.6%
[
1.5%
-
2.0%
]
1.79%
234,7692.9%
[
1.5%
-
2.0%
]
1.89%
45,4022.2%
[
2.0%
-
2.5%
]
2.05%
112,1121.8%
[
2.0%
-
2.5%
]
2.20%
52,2061.6%
[
2.0%
-
2.5%
]
2.27%
44,0331.9%
[
2.0%
-
2.5%
]
2.39%
19,0314.1%
[
2.5%
-
3.0%
]
2.55%
9,6343.4%
[
2.5%
-
3.0%
]
2.67%
12,8092.1%
[
2.5%
-
3.0%
]
2.77%
51,7204.1%
[
2.5%
-
3.0%
]
2.89%
1,2464.7%
[
3.0%
-
3.5%
]
3.07%
6,4141.5%
[
3.0%
-
3.5%
]
3.19%
1,5683.6%
[
3.5%
-
4.0%
]
3.56%
12,4784.3%
[
3.5%
-
4.0%
]
3.76%
1,3047.2%
[
3.5%
-
4.0%
]
3.98%
4,1500.49%
[
4.0%
-
4.5%
]
4.19%
2,1230.90%
[
4.0%
-
4.5%
]
4.35%
26,5565.2%
[
4.5%
-
5.0%
]
4.61%
1,6926.6%
[
5.0%
-
5.5%
]
5.03%
1,3921.8%
[
5.0%
-
5.5%
]
5.12%
7226.0%
[
5.0%
-
5.5%
]
5.21%
1,8810.78%
[
5.5%
-
6.0%
]
5.97%
23,1045.6%
[
6.5%
-
7.0%
]
6.58%
3191.8%
[
6.5%
-
7.0%
]
6.79%
6191.4%
[
6.5%
-
7.0%
]
6.97%
2,7561.9%
[
7.5%
-
8.0%
]
7.63%
2367.9%
[
8.5%
-
9.0%
]
8.94%
1,6341.1%
[
24.5%
-
25.0%
]
24.91%
5666.2%
[
25.5%
-
26.0%
]
25.97%
5436.5%