Laotian 4 or more Vehicles in Household

COMPARE

Laotian
Race
Ancestry
AfghanAfricanAlaska NativeAlaskan AthabascanAlbanianAleutAlsatianAmericanApacheArabArapahoArgentineanArmenianAssyrian/Chaldean/SyriacAustralianAustrianBahamianBangladeshiBarbadianBasqueBelgianBelizeanBermudanBhutaneseBlackfeetBolivianBrazilianBritishBritish West IndianBulgarianBurmeseCajunCambodianCanadianCape VerdeanCarpatho RusynCelticCentral AmericanCentral American IndianCherokeeCheyenneChickasawChileanChineseChippewaChoctawColombianColvilleComancheCosta RicanCreeCreekCroatianCrowCubanCypriotCzechCzechoslovakianDanishDelawareDominicanDutchDutch West IndianEastern EuropeanEcuadorianEgyptianEnglishEstonianEthiopianEuropeanFijianFilipinoFinnishFrenchFrench American IndianFrench CanadianGermanGerman RussianGhanaianGreekGuamanian/ChamorroGuatemalanGuyaneseHaitianHmongHonduranHopiHoumaHungarianIcelanderIndian (Asian)IndonesianInupiatIranianIraqiIrishIroquoisIsraeliItalianJamaicanJapaneseJordanianKenyanKiowaKoreanLaotianLatvianLebaneseLiberianLithuanianLumbeeLuxembourgerMacedonianMalaysianMalteseMarshalleseMenomineeMexicanMexican American IndianMongolianMoroccanNative HawaiianNavajoNepaleseNew ZealanderNicaraguanNigerianNorthern EuropeanNorwegianOkinawanOsageOttawaPaiutePakistaniPalestinianPanamanianParaguayanPennsylvania GermanPeruvianPimaPolishPortuguesePotawatomiPuebloPuerto RicanPuget Sound SalishRomanianRussianSalvadoranSamoanScandinavianScotch-IrishScottishSeminoleSenegaleseSerbianShoshoneSierra LeoneanSiouxSlavicSlovakSloveneSomaliSouth AfricanSouth AmericanSouth American IndianSoviet UnionSpaniardSpanishSpanish AmericanSpanish American IndianSri LankanSubsaharan AfricanSudaneseSwedishSwissSyrianTaiwaneseThaiTlingit-HaidaTohono O'OdhamTonganTrinidadian and TobagonianTsimshianTurkishU.S. Virgin IslanderUgandanUkrainianUruguayanUteVenezuelanVietnameseWelshWest IndianYakamaYaquiYugoslavianYumanYup'ikZimbabwean
Immigration
NonimmigrantsImmigrantsAfghanistanAfricaAlbaniaArgentinaArmeniaAsiaAustraliaAustriaBahamasBangladeshBarbadosBelarusBelgiumBelizeBoliviaBosnia and HerzegovinaBrazilBulgariaBurma/MyanmarCabo VerdeCambodiaCameroonCanadaCaribbeanCentral AmericaChileChinaColombiaCongoCosta RicaCroatiaCubaCzechoslovakiaDenmarkDominicaDominican RepublicEastern AfricaEastern AsiaEastern EuropeEcuadorEgyptEl SalvadorEnglandEritreaEthiopiaEuropeFijiFranceGermanyGhanaGreeceGrenadaGuatemalaGuyanaHaitiHondurasHong KongHungaryIndiaIndonesiaIranIraqIrelandIsraelItalyJamaicaJapanJordanKazakhstanKenyaKoreaKuwaitLaosLatin AmericaLatviaLebanonLiberiaLithuaniaMalaysiaMexicoMicronesiaMiddle AfricaMoldovaMoroccoNepalNetherlandsNicaraguaNigeriaNorth AmericaNorth MacedoniaNorthern AfricaNorthern EuropeNorwayOceaniaPakistanPanamaPeruPhilippinesPolandPortugalRomaniaRussiaSaudi ArabiaScotlandSenegalSerbiaSierra LeoneSingaporeSomaliaSouth AfricaSouth AmericaSouth Central AsiaSouth Eastern AsiaSouthern EuropeSpainSri LankaSt. Vincent and the GrenadinesSudanSwedenSwitzerlandSyriaTaiwanThailandTrinidad and TobagoTurkeyUgandaUkraineUruguayUzbekistanVenezuelaVietnamWest IndiesWestern AfricaWestern AsiaWestern EuropeYemenZaireZimbabweAzores
Select to Compare
Race
Ancestry
AfghanAfricanAlaska NativeAlaskan AthabascanAlbanianAleutAlsatianAmericanApacheArabArapahoArgentineanArmenianAssyrian/Chaldean/SyriacAustralianAustrianBahamianBangladeshiBarbadianBasqueBelgianBelizeanBermudanBhutaneseBlackfeetBolivianBrazilianBritishBritish West IndianBulgarianBurmeseCajunCambodianCanadianCape VerdeanCarpatho RusynCelticCentral AmericanCentral American IndianCherokeeCheyenneChickasawChileanChineseChippewaChoctawColombianColvilleComancheCosta RicanCreeCreekCroatianCrowCubanCypriotCzechCzechoslovakianDanishDelawareDominicanDutchDutch West IndianEastern EuropeanEcuadorianEgyptianEnglishEstonianEthiopianEuropeanFijianFilipinoFinnishFrenchFrench American IndianFrench CanadianGermanGerman RussianGhanaianGreekGuamanian/ChamorroGuatemalanGuyaneseHaitianHmongHonduranHopiHoumaHungarianIcelanderIndian (Asian)IndonesianInupiatIranianIraqiIrishIroquoisIsraeliItalianJamaicanJapaneseJordanianKenyanKiowaKoreanLatvianLebaneseLiberianLithuanianLumbeeLuxembourgerMacedonianMalaysianMalteseMarshalleseMenomineeMexicanMexican American IndianMongolianMoroccanNative HawaiianNavajoNepaleseNew ZealanderNicaraguanNigerianNorthern EuropeanNorwegianOkinawanOsageOttawaPaiutePakistaniPalestinianPanamanianParaguayanPennsylvania GermanPeruvianPimaPolishPortuguesePotawatomiPuebloPuerto RicanPuget Sound SalishRomanianRussianSalvadoranSamoanScandinavianScotch-IrishScottishSeminoleSenegaleseSerbianShoshoneSierra LeoneanSiouxSlavicSlovakSloveneSomaliSouth AfricanSouth AmericanSouth American IndianSoviet UnionSpaniardSpanishSpanish AmericanSpanish American IndianSri LankanSubsaharan AfricanSudaneseSwedishSwissSyrianTaiwaneseThaiTlingit-HaidaTohono O'OdhamTonganTrinidadian and TobagonianTsimshianTurkishU.S. Virgin IslanderUgandanUkrainianUruguayanUteVenezuelanVietnameseWelshWest IndianYakamaYaquiYugoslavianYumanYup'ikZimbabwean
Immigration
NonimmigrantsImmigrantsAfghanistanAfricaAlbaniaArgentinaArmeniaAsiaAustraliaAustriaBahamasBangladeshBarbadosBelarusBelgiumBelizeBoliviaBosnia and HerzegovinaBrazilBulgariaBurma/MyanmarCabo VerdeCambodiaCameroonCanadaCaribbeanCentral AmericaChileChinaColombiaCongoCosta RicaCroatiaCubaCzechoslovakiaDenmarkDominicaDominican RepublicEastern AfricaEastern AsiaEastern EuropeEcuadorEgyptEl SalvadorEnglandEritreaEthiopiaEuropeFijiFranceGermanyGhanaGreeceGrenadaGuatemalaGuyanaHaitiHondurasHong KongHungaryIndiaIndonesiaIranIraqIrelandIsraelItalyJamaicaJapanJordanKazakhstanKenyaKoreaKuwaitLaosLatin AmericaLatviaLebanonLiberiaLithuaniaMalaysiaMexicoMicronesiaMiddle AfricaMoldovaMoroccoNepalNetherlandsNicaraguaNigeriaNorth AmericaNorth MacedoniaNorthern AfricaNorthern EuropeNorwayOceaniaPakistanPanamaPeruPhilippinesPolandPortugalRomaniaRussiaSaudi ArabiaScotlandSenegalSerbiaSierra LeoneSingaporeSomaliaSouth AfricaSouth AmericaSouth Central AsiaSouth Eastern AsiaSouthern EuropeSpainSri LankaSt. Vincent and the GrenadinesSudanSwedenSwitzerlandSyriaTaiwanThailandTrinidad and TobagoTurkeyUgandaUkraineUruguayUzbekistanVenezuelaVietnamWest IndiesWestern AfricaWestern AsiaWestern EuropeYemenZaireZimbabweAzores
4 or more Vehicles in Household
Income
Poverty
Unemployment
Labor Participation
Family Structure
Vehicle Availability
Education Level
Disability

Laotian 4 or more Vehicles in Household
Exceptional

7.4%
4+ VEHICLES AVAILABLE
99.9/ 100
METRIC RATING
76th/ 347
METRIC RANK

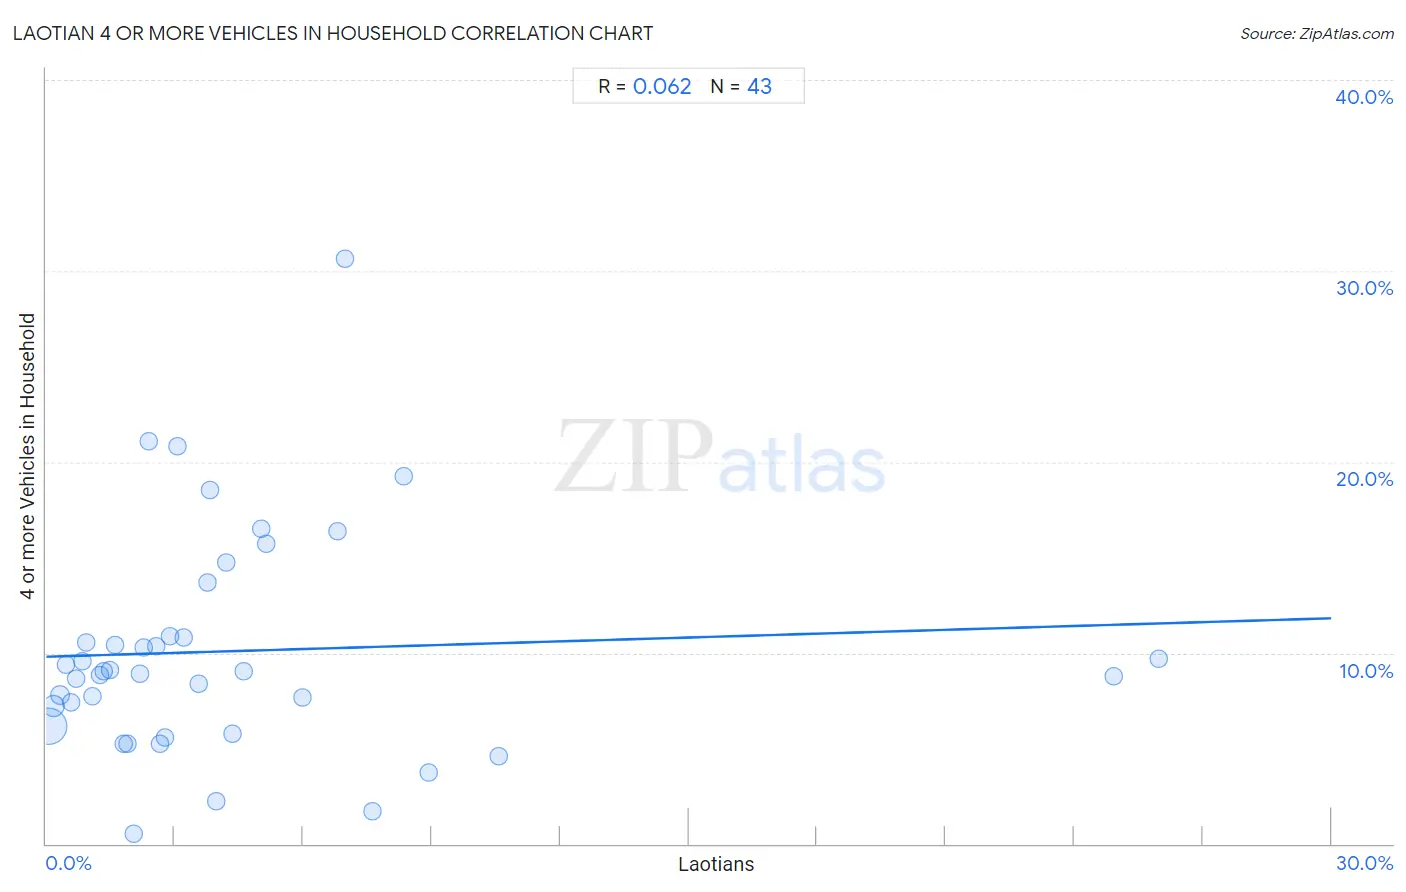
Laotian 4 or more Vehicles in Household Correlation Chart

The statistical analysis conducted on geographies consisting of 224,004,331 people shows a slight positive correlation between the proportion of Laotians and percentage of households with 4 or more vehicles available in the United States with a correlation coefficient (R) of 0.062 and weighted average of 7.4%. On average, for every 1% (one percent) increase in Laotians within a typical geography, there is an increase of 0.067% in percentage of households with 4 or more vehicles available.
Laotian 4 or more Vehicles in Household
It is essential to understand that the correlation between the percentage of Laotians and percentage of households with 4 or more vehicles available does not imply a direct cause-and-effect relationship. It remains uncertain whether the presence of Laotians influences an upward or downward trend in the level of percentage of households with 4 or more vehicles available within an area, or if Laotians simply ended up residing in those areas with higher or lower levels of percentage of households with 4 or more vehicles available due to other factors.

Demographics Similar to Laotians by 4 or more Vehicles in Household

In terms of 4 or more vehicles in household, the demographic groups most similar to Laotians are Icelander (7.4%, a difference of 0.050%), Immigrants from Cambodia (7.4%, a difference of 0.050%), Apache (7.4%, a difference of 0.17%), White/Caucasian (7.4%, a difference of 0.23%), and Portuguese (7.4%, a difference of 0.36%).
DemographicsRating | Rank4 or more Vehicles in Household
Germans
99.9
/100
|
#69
Exceptional
7.5%
Scottish
99.9
/100
|
#70
Exceptional
7.4%
Chickasaw
99.9
/100
|
#71
Exceptional
7.4%
Scotch-Irish
99.9
/100
|
#72
Exceptional
7.4%
Portuguese
99.9
/100
|
#73
Exceptional
7.4%
Icelanders
99.9
/100
|
#74
Exceptional
7.4%
Immigrants from Cambodia
99.9
/100
|
#75
Exceptional
7.4%
Laotians
99.9
/100
|
#76
Exceptional
7.4%
Apache
99.9
/100
|
#77
Exceptional
7.4%
Whites/Caucasians
99.8
/100
|
#78
Exceptional
7.4%
Czechs
99.8
/100
|
#79
Exceptional
7.4%
Alaska Natives
99.8
/100
|
#80
Exceptional
7.3%
Finns
99.8
/100
|
#81
Exceptional
7.3%
Northern Europeans
99.8
/100
|
#82
Exceptional
7.3%
Potawatomi
99.7
/100
|
#83
Exceptional
7.3%

Laotian 4 or more Vehicles in Household Correlation Summary

MeasurementLaotian Data4 or more Vehicles in Household Data
Minimum0.051%0.54%
Maximum26.0%30.6%
Range25.9%30.1%
Mean4.3%10.1%
Median2.8%9.0%
Interquartile 25% (IQ1)1.3%6.1%
Interquartile 75% (IQ3)5.0%10.8%
Interquartile Range (IQR)3.7%4.7%
Standard Deviation (Sample)5.4%5.8%
Standard Deviation (Population)5.3%5.8%

Correlation Details

Laotian PercentileSample Size4 or more Vehicles in Household
[
0.0%
-
0.5%
]
0.051%
165,012,7476.1%
[
0.0%
-
0.5%
]
0.18%
36,288,3697.2%
[
0.0%
-
0.5%
]
0.31%
10,197,1567.8%
[
0.0%
-
0.5%
]
0.45%
5,430,8129.4%
[
0.5%
-
1.0%
]
0.59%
2,241,2357.4%
[
0.5%
-
1.0%
]
0.71%
2,031,5278.6%
[
0.5%
-
1.0%
]
0.85%
809,8739.6%
[
0.5%
-
1.0%
]
0.94%
618,62510.5%
[
1.0%
-
1.5%
]
1.08%
173,9847.7%
[
1.0%
-
1.5%
]
1.26%
208,7918.9%
[
1.0%
-
1.5%
]
1.35%
135,8959.0%
[
1.0%
-
1.5%
]
1.49%
158,7179.1%
[
1.5%
-
2.0%
]
1.61%
18,18410.4%
[
1.5%
-
2.0%
]
1.80%
230,4715.2%
[
1.5%
-
2.0%
]
1.89%
45,9335.2%
[
2.0%
-
2.5%
]
2.05%
112,9790.54%
[
2.0%
-
2.5%
]
2.19%
59,2818.9%
[
2.0%
-
2.5%
]
2.27%
44,03310.2%
[
2.0%
-
2.5%
]
2.39%
19,03121.1%
[
2.5%
-
3.0%
]
2.55%
9,27610.3%
[
2.5%
-
3.0%
]
2.67%
12,8095.2%
[
2.5%
-
3.0%
]
2.77%
51,7205.5%
[
2.5%
-
3.0%
]
2.89%
1,24610.8%
[
3.0%
-
3.5%
]
3.07%
6,41420.8%
[
3.0%
-
3.5%
]
3.20%
2,46610.8%
[
3.5%
-
4.0%
]
3.56%
12,4788.4%
[
3.5%
-
4.0%
]
3.76%
1,30413.7%
[
3.5%
-
4.0%
]
3.82%
89018.5%
[
3.5%
-
4.0%
]
3.98%
4,1502.2%
[
4.0%
-
4.5%
]
4.19%
2,12314.8%
[
4.0%
-
4.5%
]
4.35%
26,5565.7%
[
4.5%
-
5.0%
]
4.61%
1,6929.0%
[
5.0%
-
5.5%
]
5.03%
1,39216.5%
[
5.0%
-
5.5%
]
5.12%
72215.7%
[
5.5%
-
6.0%
]
5.98%
23,7927.7%
[
6.5%
-
7.0%
]
6.79%
61916.4%
[
6.5%
-
7.0%
]
6.97%
2,75630.6%
[
7.5%
-
8.0%
]
7.63%
2361.7%
[
8.0%
-
8.5%
]
8.33%
8419.2%
[
8.5%
-
9.0%
]
8.94%
1,6343.7%
[
10.5%
-
11.0%
]
10.57%
1,2204.6%
[
24.5%
-
25.0%
]
24.91%
5668.8%
[
25.5%
-
26.0%
]
25.97%
5439.7%