Laotian Unemployment Among Women with Children Ages 6 to 17 years

COMPARE

Laotian
Race
Ancestry
AfghanAfricanAlaska NativeAlaskan AthabascanAlbanianAleutAlsatianAmericanApacheArabArapahoArgentineanArmenianAssyrian/Chaldean/SyriacAustralianAustrianBahamianBangladeshiBarbadianBasqueBelgianBelizeanBermudanBhutaneseBlackfeetBolivianBrazilianBritishBritish West IndianBulgarianBurmeseCajunCambodianCanadianCape VerdeanCarpatho RusynCelticCentral AmericanCentral American IndianCherokeeCheyenneChickasawChileanChineseChippewaChoctawColombianColvilleComancheCosta RicanCreeCreekCroatianCrowCubanCypriotCzechCzechoslovakianDanishDelawareDominicanDutchDutch West IndianEastern EuropeanEcuadorianEgyptianEnglishEstonianEthiopianEuropeanFijianFilipinoFinnishFrenchFrench American IndianFrench CanadianGermanGerman RussianGhanaianGreekGuamanian/ChamorroGuatemalanGuyaneseHaitianHmongHonduranHopiHoumaHungarianIcelanderIndian (Asian)IndonesianInupiatIranianIraqiIrishIroquoisIsraeliItalianJamaicanJapaneseJordanianKenyanKiowaKoreanLaotianLatvianLebaneseLiberianLithuanianLumbeeLuxembourgerMacedonianMalaysianMalteseMarshalleseMenomineeMexicanMexican American IndianMongolianMoroccanNative HawaiianNavajoNepaleseNew ZealanderNicaraguanNigerianNorthern EuropeanNorwegianOkinawanOsageOttawaPaiutePakistaniPalestinianPanamanianParaguayanPennsylvania GermanPeruvianPimaPolishPortuguesePotawatomiPuebloPuerto RicanPuget Sound SalishRomanianRussianSalvadoranSamoanScandinavianScotch-IrishScottishSeminoleSenegaleseSerbianShoshoneSierra LeoneanSiouxSlavicSlovakSloveneSomaliSouth AfricanSouth AmericanSouth American IndianSoviet UnionSpaniardSpanishSpanish AmericanSpanish American IndianSri LankanSubsaharan AfricanSudaneseSwedishSwissSyrianTaiwaneseThaiTlingit-HaidaTohono O'OdhamTonganTrinidadian and TobagonianTsimshianTurkishU.S. Virgin IslanderUgandanUkrainianUruguayanUteVenezuelanVietnameseWelshWest IndianYakamaYaquiYugoslavianYumanYup'ikZimbabwean
Immigration
NonimmigrantsImmigrantsAfghanistanAfricaAlbaniaArgentinaArmeniaAsiaAustraliaAustriaBahamasBangladeshBarbadosBelarusBelgiumBelizeBoliviaBosnia and HerzegovinaBrazilBulgariaBurma/MyanmarCabo VerdeCambodiaCameroonCanadaCaribbeanCentral AmericaChileChinaColombiaCongoCosta RicaCroatiaCubaCzechoslovakiaDenmarkDominicaDominican RepublicEastern AfricaEastern AsiaEastern EuropeEcuadorEgyptEl SalvadorEnglandEritreaEthiopiaEuropeFijiFranceGermanyGhanaGreeceGrenadaGuatemalaGuyanaHaitiHondurasHong KongHungaryIndiaIndonesiaIranIraqIrelandIsraelItalyJamaicaJapanJordanKazakhstanKenyaKoreaKuwaitLaosLatin AmericaLatviaLebanonLiberiaLithuaniaMalaysiaMexicoMicronesiaMiddle AfricaMoldovaMoroccoNepalNetherlandsNicaraguaNigeriaNorth AmericaNorth MacedoniaNorthern AfricaNorthern EuropeNorwayOceaniaPakistanPanamaPeruPhilippinesPolandPortugalRomaniaRussiaSaudi ArabiaScotlandSenegalSerbiaSierra LeoneSingaporeSomaliaSouth AfricaSouth AmericaSouth Central AsiaSouth Eastern AsiaSouthern EuropeSpainSri LankaSt. Vincent and the GrenadinesSudanSwedenSwitzerlandSyriaTaiwanThailandTrinidad and TobagoTurkeyUgandaUkraineUruguayUzbekistanVenezuelaVietnamWest IndiesWestern AfricaWestern AsiaWestern EuropeYemenZaireZimbabweAzores
Select to Compare
Race
Ancestry
AfghanAfricanAlaska NativeAlaskan AthabascanAlbanianAleutAlsatianAmericanApacheArabArapahoArgentineanArmenianAssyrian/Chaldean/SyriacAustralianAustrianBahamianBangladeshiBarbadianBasqueBelgianBelizeanBermudanBhutaneseBlackfeetBolivianBrazilianBritishBritish West IndianBulgarianBurmeseCajunCambodianCanadianCape VerdeanCarpatho RusynCelticCentral AmericanCentral American IndianCherokeeCheyenneChickasawChileanChineseChippewaChoctawColombianColvilleComancheCosta RicanCreeCreekCroatianCrowCubanCypriotCzechCzechoslovakianDanishDelawareDominicanDutchDutch West IndianEastern EuropeanEcuadorianEgyptianEnglishEstonianEthiopianEuropeanFijianFilipinoFinnishFrenchFrench American IndianFrench CanadianGermanGerman RussianGhanaianGreekGuamanian/ChamorroGuatemalanGuyaneseHaitianHmongHonduranHopiHoumaHungarianIcelanderIndian (Asian)IndonesianInupiatIranianIraqiIrishIroquoisIsraeliItalianJamaicanJapaneseJordanianKenyanKiowaKoreanLatvianLebaneseLiberianLithuanianLumbeeLuxembourgerMacedonianMalaysianMalteseMarshalleseMenomineeMexicanMexican American IndianMongolianMoroccanNative HawaiianNavajoNepaleseNew ZealanderNicaraguanNigerianNorthern EuropeanNorwegianOkinawanOsageOttawaPaiutePakistaniPalestinianPanamanianParaguayanPennsylvania GermanPeruvianPimaPolishPortuguesePotawatomiPuebloPuerto RicanPuget Sound SalishRomanianRussianSalvadoranSamoanScandinavianScotch-IrishScottishSeminoleSenegaleseSerbianShoshoneSierra LeoneanSiouxSlavicSlovakSloveneSomaliSouth AfricanSouth AmericanSouth American IndianSoviet UnionSpaniardSpanishSpanish AmericanSpanish American IndianSri LankanSubsaharan AfricanSudaneseSwedishSwissSyrianTaiwaneseThaiTlingit-HaidaTohono O'OdhamTonganTrinidadian and TobagonianTsimshianTurkishU.S. Virgin IslanderUgandanUkrainianUruguayanUteVenezuelanVietnameseWelshWest IndianYakamaYaquiYugoslavianYumanYup'ikZimbabwean
Immigration
NonimmigrantsImmigrantsAfghanistanAfricaAlbaniaArgentinaArmeniaAsiaAustraliaAustriaBahamasBangladeshBarbadosBelarusBelgiumBelizeBoliviaBosnia and HerzegovinaBrazilBulgariaBurma/MyanmarCabo VerdeCambodiaCameroonCanadaCaribbeanCentral AmericaChileChinaColombiaCongoCosta RicaCroatiaCubaCzechoslovakiaDenmarkDominicaDominican RepublicEastern AfricaEastern AsiaEastern EuropeEcuadorEgyptEl SalvadorEnglandEritreaEthiopiaEuropeFijiFranceGermanyGhanaGreeceGrenadaGuatemalaGuyanaHaitiHondurasHong KongHungaryIndiaIndonesiaIranIraqIrelandIsraelItalyJamaicaJapanJordanKazakhstanKenyaKoreaKuwaitLaosLatin AmericaLatviaLebanonLiberiaLithuaniaMalaysiaMexicoMicronesiaMiddle AfricaMoldovaMoroccoNepalNetherlandsNicaraguaNigeriaNorth AmericaNorth MacedoniaNorthern AfricaNorthern EuropeNorwayOceaniaPakistanPanamaPeruPhilippinesPolandPortugalRomaniaRussiaSaudi ArabiaScotlandSenegalSerbiaSierra LeoneSingaporeSomaliaSouth AfricaSouth AmericaSouth Central AsiaSouth Eastern AsiaSouthern EuropeSpainSri LankaSt. Vincent and the GrenadinesSudanSwedenSwitzerlandSyriaTaiwanThailandTrinidad and TobagoTurkeyUgandaUkraineUruguayUzbekistanVenezuelaVietnamWest IndiesWestern AfricaWestern AsiaWestern EuropeYemenZaireZimbabweAzores
Unemployment Among Women with Children Ages 6 to 17 years
Income
Poverty
Unemployment
Labor Participation
Family Structure
Vehicle Availability
Education Level
Disability

Laotian Unemployment Among Women with Children Ages 6 to 17 years
Exceptional

7.9%
UNEMPLOYMENT | WOMEN W/ CHILDREN 6 TO 17
100.0/ 100
METRIC RATING
31st/ 347
METRIC RANK

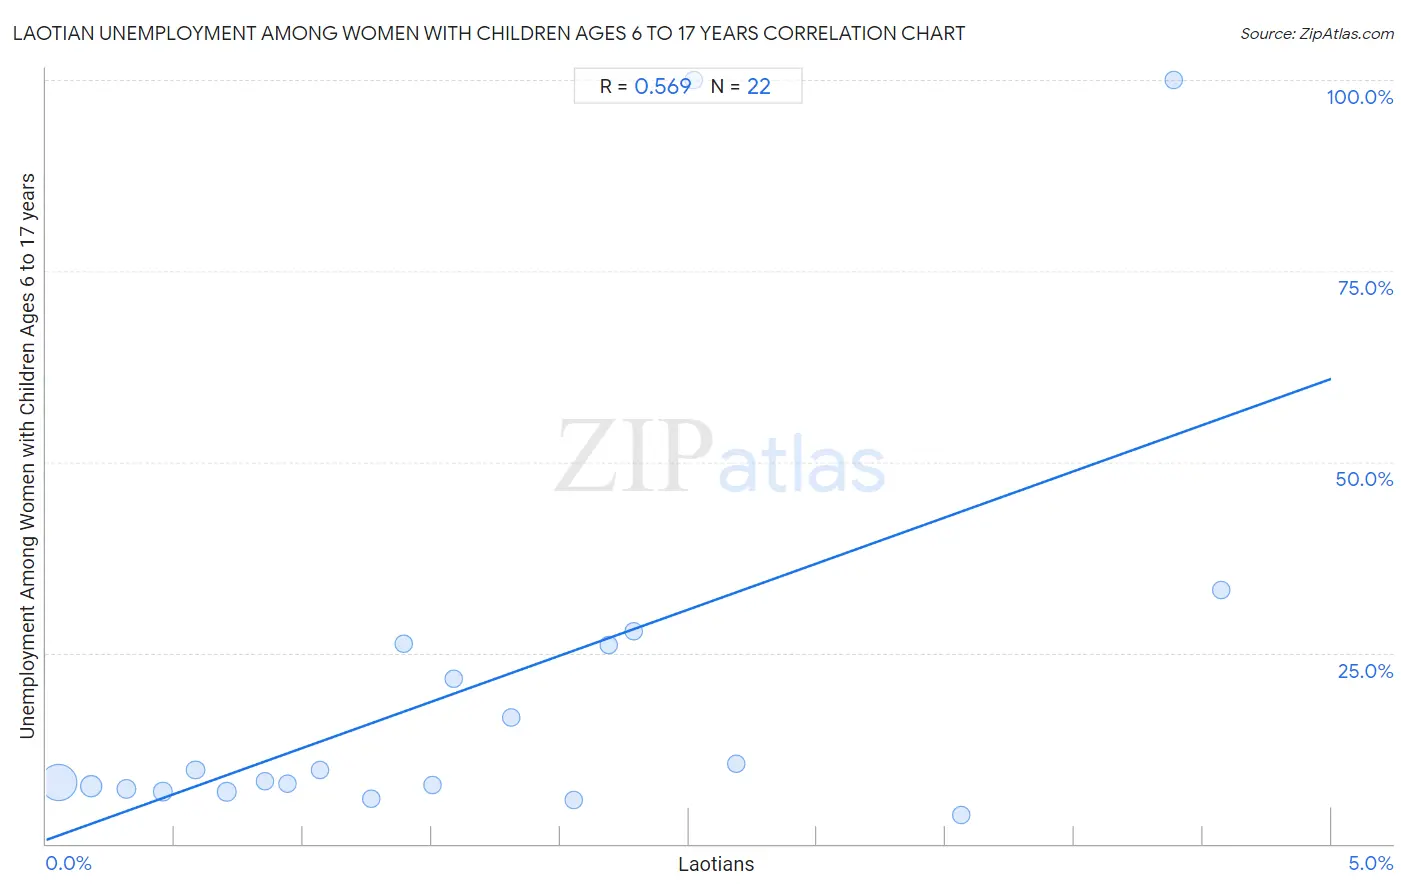
Laotian Unemployment Among Women with Children Ages 6 to 17 years Correlation Chart

The statistical analysis conducted on geographies consisting of 181,430,128 people shows a substantial positive correlation between the proportion of Laotians and unemployment rate among women with children between the ages 6 and 17 in the United States with a correlation coefficient (R) of 0.569 and weighted average of 7.9%. On average, for every 1% (one percent) increase in Laotians within a typical geography, there is an increase of 12.1% in unemployment rate among women with children between the ages 6 and 17.
Laotian Unemployment Among Women with Children Ages 6 to 17 years
It is essential to understand that the correlation between the percentage of Laotians and unemployment rate among women with children between the ages 6 and 17 does not imply a direct cause-and-effect relationship. It remains uncertain whether the presence of Laotians influences an upward or downward trend in the level of unemployment rate among women with children between the ages 6 and 17 within an area, or if Laotians simply ended up residing in those areas with higher or lower levels of unemployment rate among women with children between the ages 6 and 17 due to other factors.

Demographics Similar to Laotians by Unemployment Among Women with Children Ages 6 to 17 years

In terms of unemployment among women with children ages 6 to 17 years, the demographic groups most similar to Laotians are Immigrants from Cambodia (7.9%, a difference of 0.050%), Immigrants from Korea (7.9%, a difference of 0.11%), Immigrants from Iran (7.9%, a difference of 0.19%), Native Hawaiian (7.9%, a difference of 0.39%), and Immigrants from South Central Asia (7.9%, a difference of 0.50%).
DemographicsRating | RankUnemployment Among Women with Children Ages 6 to 17 years
Nepalese
100.0
/100
|
#24
Exceptional
7.7%
Immigrants from Eastern Asia
100.0
/100
|
#25
Exceptional
7.7%
Indians (Asian)
100.0
/100
|
#26
Exceptional
7.7%
Immigrants from Afghanistan
100.0
/100
|
#27
Exceptional
7.8%
Immigrants from Uzbekistan
100.0
/100
|
#28
Exceptional
7.8%
Thais
100.0
/100
|
#29
Exceptional
7.8%
Immigrants from Iran
100.0
/100
|
#30
Exceptional
7.9%
Laotians
100.0
/100
|
#31
Exceptional
7.9%
Immigrants from Cambodia
100.0
/100
|
#32
Exceptional
7.9%
Immigrants from Korea
100.0
/100
|
#33
Exceptional
7.9%
Native Hawaiians
100.0
/100
|
#34
Exceptional
7.9%
Immigrants from South Central Asia
100.0
/100
|
#35
Exceptional
7.9%
Burmese
100.0
/100
|
#36
Exceptional
8.0%
Asians
100.0
/100
|
#37
Exceptional
8.0%
Alsatians
100.0
/100
|
#38
Exceptional
8.0%

Laotian Unemployment Among Women with Children Ages 6 to 17 years Correlation Summary

MeasurementLaotian DataUnemployment Among Women with Children Ages 6 to 17 years Data
Minimum0.050%3.7%
Maximum4.6%100.0%
Range4.5%96.3%
Mean1.7%20.8%
Median1.4%8.9%
Interquartile 25% (IQ1)0.70%7.2%
Interquartile 75% (IQ3)2.3%26.1%
Interquartile Range (IQR)1.6%18.9%
Standard Deviation (Sample)1.3%27.0%
Standard Deviation (Population)1.2%26.4%

Correlation Details

Laotian PercentileSample SizeUnemployment Among Women with Children Ages 6 to 17 years
[
0.0%
-
0.5%
]
0.050%
137,752,7848.0%
[
0.0%
-
0.5%
]
0.18%
28,546,7867.6%
[
0.0%
-
0.5%
]
0.31%
6,862,0107.2%
[
0.0%
-
0.5%
]
0.45%
4,121,6496.9%
[
0.5%
-
1.0%
]
0.58%
1,261,0829.7%
[
0.5%
-
1.0%
]
0.70%
1,311,1976.8%
[
0.5%
-
1.0%
]
0.85%
434,8378.1%
[
0.5%
-
1.0%
]
0.94%
440,5577.8%
[
1.0%
-
1.5%
]
1.07%
123,4039.7%
[
1.0%
-
1.5%
]
1.27%
169,5685.8%
[
1.0%
-
1.5%
]
1.39%
29,16226.2%
[
1.5%
-
2.0%
]
1.50%
51,9587.7%
[
1.5%
-
2.0%
]
1.59%
11,10021.7%
[
1.5%
-
2.0%
]
1.81%
160,14816.5%
[
2.0%
-
2.5%
]
2.05%
102,6185.8%
[
2.0%
-
2.5%
]
2.19%
16,50826.1%
[
2.0%
-
2.5%
]
2.28%
12,56427.9%
[
2.5%
-
3.0%
]
2.52%
714100.0%
[
2.5%
-
3.0%
]
2.68%
7,71010.5%
[
3.5%
-
4.0%
]
3.56%
12,4783.7%
[
4.0%
-
4.5%
]
4.39%
661100.0%
[
4.5%
-
5.0%
]
4.57%
63433.3%