Laotian Married-couple Households
COMPARE
Laotian
Select to Compare
Married-couple Households
Laotian Married-couple Households
48.4%
MARRIED-COUPLE HOUSEHOLDS
98.8/ 100
METRIC RATING
71st/ 347
METRIC RANK
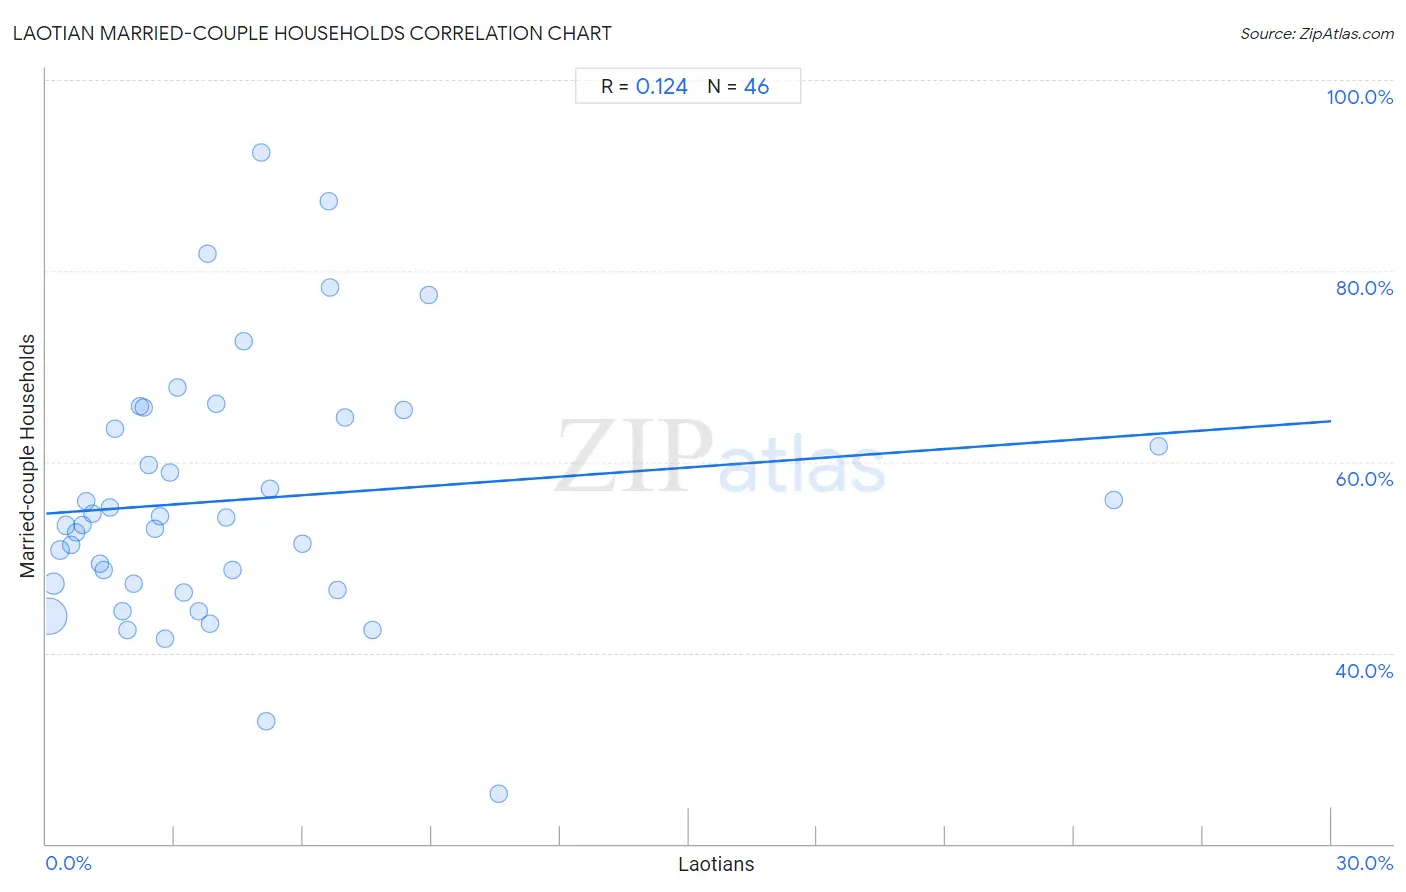
Laotian Married-couple Households Correlation Chart
The statistical analysis conducted on geographies consisting of 224,741,438 people shows a poor positive correlation between the proportion of Laotians and percentage of married-couple family households in the United States with a correlation coefficient (R) of 0.124 and weighted average of 48.4%. On average, for every 1% (one percent) increase in Laotians within a typical geography, there is an increase of 0.32% in percentage of married-couple family households.
It is essential to understand that the correlation between the percentage of Laotians and percentage of married-couple family households does not imply a direct cause-and-effect relationship. It remains uncertain whether the presence of Laotians influences an upward or downward trend in the level of percentage of married-couple family households within an area, or if Laotians simply ended up residing in those areas with higher or lower levels of percentage of married-couple family households due to other factors.
Demographics Similar to Laotians by Married-couple Households
In terms of married-couple households, the demographic groups most similar to Laotians are Immigrants from North America (48.4%, a difference of 0.010%), Immigrants from South Eastern Asia (48.4%, a difference of 0.050%), Immigrants from China (48.4%, a difference of 0.050%), Jordanian (48.4%, a difference of 0.070%), and Romanian (48.4%, a difference of 0.070%).
| Demographics | Rating | Rank | Married-couple Households |
| Northern Europeans | 99.0 /100 | #64 | Exceptional 48.4% |
| Immigrants from Canada | 99.0 /100 | #65 | Exceptional 48.4% |
| Jordanians | 98.9 /100 | #66 | Exceptional 48.4% |
| Romanians | 98.9 /100 | #67 | Exceptional 48.4% |
| Immigrants from South Eastern Asia | 98.9 /100 | #68 | Exceptional 48.4% |
| Immigrants from China | 98.9 /100 | #69 | Exceptional 48.4% |
| Immigrants from North America | 98.9 /100 | #70 | Exceptional 48.4% |
| Laotians | 98.8 /100 | #71 | Exceptional 48.4% |
| Scotch-Irish | 98.6 /100 | #72 | Exceptional 48.3% |
| Immigrants from Singapore | 98.6 /100 | #73 | Exceptional 48.3% |
| Immigrants from Romania | 98.6 /100 | #74 | Exceptional 48.3% |
| Immigrants from England | 98.4 /100 | #75 | Exceptional 48.2% |
| Immigrants from Fiji | 98.4 /100 | #76 | Exceptional 48.2% |
| Canadians | 98.2 /100 | #77 | Exceptional 48.2% |
| Egyptians | 98.2 /100 | #78 | Exceptional 48.2% |
Laotian Married-couple Households Correlation Summary
| Measurement | Laotian Data | Married-couple Households Data |
| Minimum | 0.051% | 25.2% |
| Maximum | 26.0% | 92.4% |
| Range | 25.9% | 67.2% |
| Mean | 4.4% | 56.0% |
| Median | 3.0% | 53.8% |
| Interquartile 25% (IQ1) | 1.5% | 47.2% |
| Interquartile 75% (IQ3) | 5.2% | 64.7% |
| Interquartile Range (IQR) | 3.7% | 17.5% |
| Standard Deviation (Sample) | 5.2% | 13.5% |
| Standard Deviation (Population) | 5.1% | 13.3% |
Correlation Details
| Laotian Percentile | Sample Size | Married-couple Households |
[ 0.0% - 0.5% ] 0.051% | 165,529,246 | 43.9% |
[ 0.0% - 0.5% ] 0.18% | 36,352,968 | 47.3% |
[ 0.0% - 0.5% ] 0.31% | 10,242,973 | 50.8% |
[ 0.0% - 0.5% ] 0.45% | 5,490,936 | 53.3% |
[ 0.5% - 1.0% ] 0.59% | 2,241,235 | 51.3% |
[ 0.5% - 1.0% ] 0.71% | 2,036,833 | 52.6% |
[ 0.5% - 1.0% ] 0.85% | 813,243 | 53.4% |
[ 0.5% - 1.0% ] 0.94% | 620,543 | 55.8% |
[ 1.0% - 1.5% ] 1.08% | 173,984 | 54.5% |
[ 1.0% - 1.5% ] 1.26% | 212,886 | 49.3% |
[ 1.0% - 1.5% ] 1.36% | 162,834 | 48.6% |
[ 1.0% - 1.5% ] 1.49% | 158,717 | 55.2% |
[ 1.5% - 2.0% ] 1.61% | 18,184 | 63.5% |
[ 1.5% - 2.0% ] 1.79% | 235,830 | 44.4% |
[ 1.5% - 2.0% ] 1.89% | 45,933 | 42.4% |
[ 2.0% - 2.5% ] 2.05% | 112,979 | 47.2% |
[ 2.0% - 2.5% ] 2.19% | 59,281 | 65.8% |
[ 2.0% - 2.5% ] 2.27% | 44,033 | 65.7% |
[ 2.0% - 2.5% ] 2.39% | 19,031 | 59.6% |
[ 2.5% - 3.0% ] 2.55% | 9,634 | 53.0% |
[ 2.5% - 3.0% ] 2.67% | 12,809 | 54.3% |
[ 2.5% - 3.0% ] 2.77% | 51,720 | 41.4% |
[ 2.5% - 3.0% ] 2.89% | 1,246 | 58.9% |
[ 3.0% - 3.5% ] 3.07% | 6,414 | 67.8% |
[ 3.0% - 3.5% ] 3.20% | 2,466 | 46.3% |
[ 3.5% - 4.0% ] 3.56% | 12,478 | 44.3% |
[ 3.5% - 4.0% ] 3.76% | 1,304 | 81.9% |
[ 3.5% - 4.0% ] 3.82% | 890 | 43.1% |
[ 3.5% - 4.0% ] 3.98% | 4,150 | 66.1% |
[ 4.0% - 4.5% ] 4.19% | 2,123 | 54.2% |
[ 4.0% - 4.5% ] 4.35% | 26,556 | 48.7% |
[ 4.5% - 5.0% ] 4.61% | 1,692 | 72.6% |
[ 5.0% - 5.5% ] 5.03% | 1,392 | 92.4% |
[ 5.0% - 5.5% ] 5.12% | 722 | 32.8% |
[ 5.0% - 5.5% ] 5.21% | 2,052 | 57.2% |
[ 5.5% - 6.0% ] 5.98% | 23,842 | 51.4% |
[ 6.5% - 7.0% ] 6.58% | 319 | 87.3% |
[ 6.5% - 7.0% ] 6.62% | 302 | 78.3% |
[ 6.5% - 7.0% ] 6.79% | 619 | 46.6% |
[ 6.5% - 7.0% ] 6.97% | 2,756 | 64.7% |
[ 7.5% - 8.0% ] 7.63% | 236 | 42.4% |
[ 8.0% - 8.5% ] 8.33% | 84 | 65.4% |
[ 8.5% - 9.0% ] 8.94% | 1,634 | 77.5% |
[ 10.5% - 11.0% ] 10.57% | 1,220 | 25.2% |
[ 24.5% - 25.0% ] 24.91% | 566 | 56.0% |
[ 25.5% - 26.0% ] 25.97% | 543 | 61.7% |