Czech Male Disability
COMPARE
Czech
Select to Compare
Male Disability
Czech Male Disability
11.9%
DISABILITY | MALES
1.1/ 100
METRIC RATING
240th/ 347
METRIC RANK
Czech Male Disability Correlation Chart
The statistical analysis conducted on geographies consisting of 484,720,527 people shows a poor positive correlation between the proportion of Czechs and percentage of males with a disability in the United States with a correlation coefficient (R) of 0.163 and weighted average of 11.9%. On average, for every 1% (one percent) increase in Czechs within a typical geography, there is an increase of 0.076% in percentage of males with a disability.
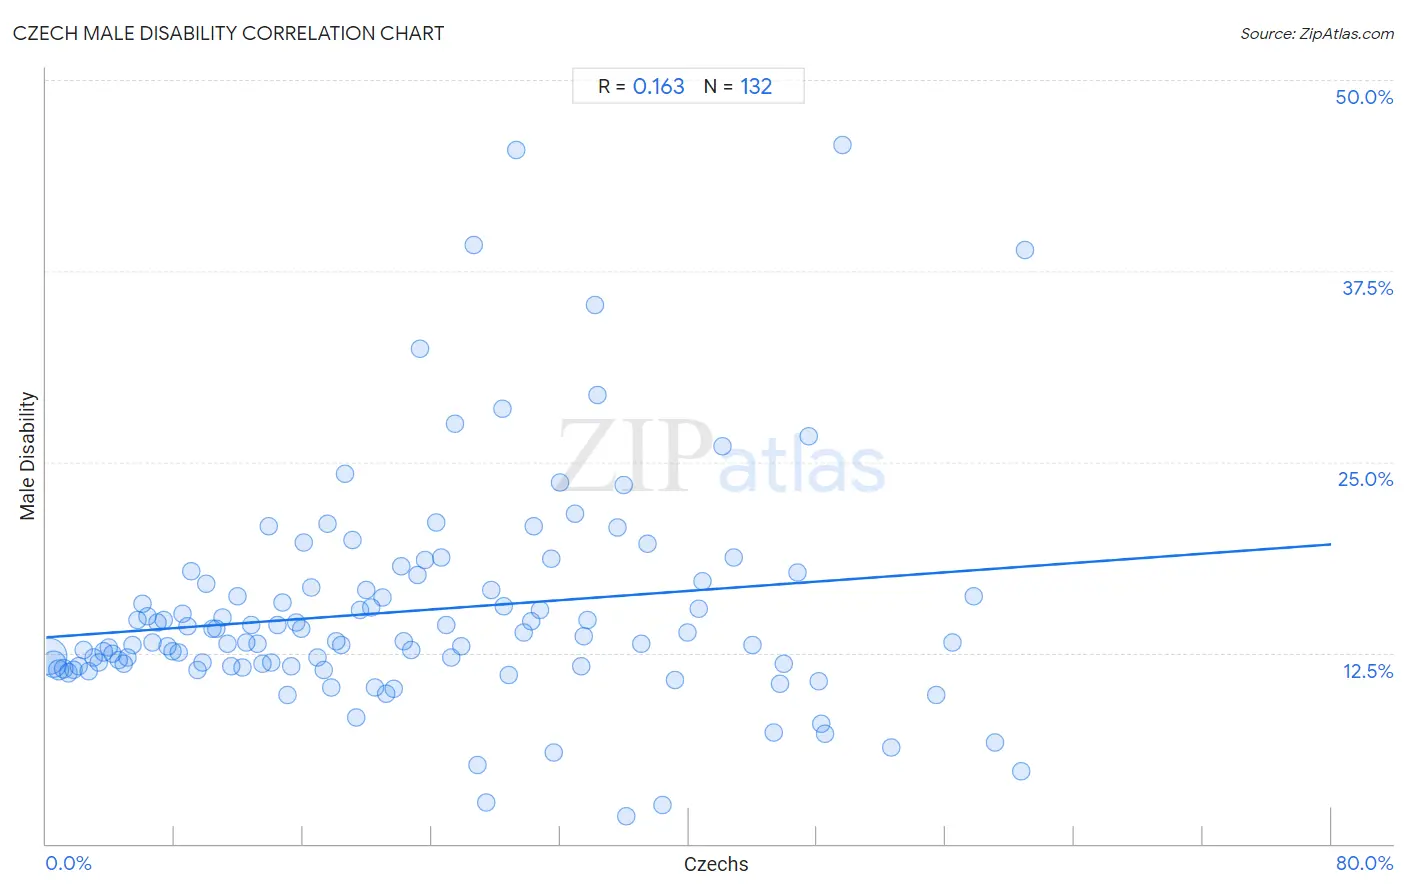
It is essential to understand that the correlation between the percentage of Czechs and percentage of males with a disability does not imply a direct cause-and-effect relationship. It remains uncertain whether the presence of Czechs influences an upward or downward trend in the level of percentage of males with a disability within an area, or if Czechs simply ended up residing in those areas with higher or lower levels of percentage of males with a disability due to other factors.
Demographics Similar to Czechs by Male Disability
In terms of male disability, the demographic groups most similar to Czechs are Bahamian (11.9%, a difference of 0.040%), Italian (11.9%, a difference of 0.050%), Northern European (11.9%, a difference of 0.050%), Samoan (11.9%, a difference of 0.080%), and Yugoslavian (11.9%, a difference of 0.10%).
| Demographics | Rating | Rank | Male Disability |
| Mexicans | 1.7 /100 | #233 | Tragic 11.8% |
| Immigrants from Canada | 1.6 /100 | #234 | Tragic 11.9% |
| Immigrants from North America | 1.5 /100 | #235 | Tragic 11.9% |
| U.S. Virgin Islanders | 1.3 /100 | #236 | Tragic 11.9% |
| Carpatho Rusyns | 1.3 /100 | #237 | Tragic 11.9% |
| Yugoslavians | 1.2 /100 | #238 | Tragic 11.9% |
| Italians | 1.2 /100 | #239 | Tragic 11.9% |
| Czechs | 1.1 /100 | #240 | Tragic 11.9% |
| Bahamians | 1.1 /100 | #241 | Tragic 11.9% |
| Northern Europeans | 1.1 /100 | #242 | Tragic 11.9% |
| Samoans | 1.1 /100 | #243 | Tragic 11.9% |
| Immigrants from Laos | 1.0 /100 | #244 | Tragic 11.9% |
| Immigrants from Liberia | 1.0 /100 | #245 | Tragic 11.9% |
| Danes | 0.9 /100 | #246 | Tragic 11.9% |
| Hungarians | 0.8 /100 | #247 | Tragic 12.0% |
Czech Male Disability Correlation Summary
| Measurement | Czech Data | Male Disability Data |
| Minimum | 0.15% | 1.8% |
| Maximum | 60.9% | 45.8% |
| Range | 60.7% | 44.0% |
| Mean | 22.9% | 15.3% |
| Median | 20.4% | 13.3% |
| Interquartile 25% (IQ1) | 10.2% | 11.6% |
| Interquartile 75% (IQ3) | 33.4% | 16.9% |
| Interquartile Range (IQR) | 23.2% | 5.3% |
| Standard Deviation (Sample) | 15.6% | 7.2% |
| Standard Deviation (Population) | 15.5% | 7.2% |
Correlation Details
| Czech Percentile | Sample Size | Male Disability |
[ 0.0% - 0.5% ] 0.15% | 277,931,204 | 12.3% |
[ 0.0% - 0.5% ] 0.43% | 115,991,760 | 11.8% |
[ 0.5% - 1.0% ] 0.75% | 39,385,394 | 11.3% |
[ 1.0% - 1.5% ] 1.06% | 19,147,712 | 11.5% |
[ 1.0% - 1.5% ] 1.38% | 10,714,303 | 11.2% |
[ 1.5% - 2.0% ] 1.69% | 6,497,061 | 11.4% |
[ 2.0% - 2.5% ] 2.00% | 4,100,112 | 11.6% |
[ 2.0% - 2.5% ] 2.30% | 2,187,554 | 12.7% |
[ 2.5% - 3.0% ] 2.61% | 1,654,436 | 11.3% |
[ 2.5% - 3.0% ] 2.93% | 1,161,464 | 12.2% |
[ 3.0% - 3.5% ] 3.23% | 1,302,513 | 11.9% |
[ 3.5% - 4.0% ] 3.55% | 605,086 | 12.6% |
[ 3.5% - 4.0% ] 3.88% | 432,495 | 12.9% |
[ 4.0% - 4.5% ] 4.14% | 616,398 | 12.4% |
[ 4.0% - 4.5% ] 4.49% | 628,276 | 12.0% |
[ 4.5% - 5.0% ] 4.79% | 461,433 | 11.7% |
[ 5.0% - 5.5% ] 5.06% | 313,568 | 12.2% |
[ 5.0% - 5.5% ] 5.36% | 273,560 | 13.0% |
[ 5.5% - 6.0% ] 5.65% | 89,927 | 14.6% |
[ 5.5% - 6.0% ] 6.00% | 98,412 | 15.7% |
[ 6.0% - 6.5% ] 6.30% | 77,111 | 14.9% |
[ 6.5% - 7.0% ] 6.62% | 129,826 | 13.2% |
[ 6.5% - 7.0% ] 6.96% | 68,675 | 14.5% |
[ 7.0% - 7.5% ] 7.31% | 77,733 | 14.6% |
[ 7.5% - 8.0% ] 7.55% | 78,471 | 12.9% |
[ 7.5% - 8.0% ] 7.85% | 70,438 | 12.6% |
[ 8.0% - 8.5% ] 8.23% | 65,313 | 12.6% |
[ 8.0% - 8.5% ] 8.47% | 48,540 | 15.1% |
[ 8.5% - 9.0% ] 8.81% | 32,062 | 14.2% |
[ 9.0% - 9.5% ] 9.06% | 14,705 | 17.9% |
[ 9.0% - 9.5% ] 9.41% | 14,846 | 11.3% |
[ 9.5% - 10.0% ] 9.70% | 23,899 | 11.9% |
[ 9.5% - 10.0% ] 9.98% | 21,970 | 17.0% |
[ 10.0% - 10.5% ] 10.35% | 27,847 | 14.1% |
[ 10.5% - 11.0% ] 10.61% | 12,356 | 14.1% |
[ 10.5% - 11.0% ] 10.97% | 35,263 | 14.8% |
[ 11.0% - 11.5% ] 11.26% | 31,937 | 13.1% |
[ 11.5% - 12.0% ] 11.55% | 10,550 | 11.7% |
[ 11.5% - 12.0% ] 11.87% | 7,018 | 16.2% |
[ 12.0% - 12.5% ] 12.20% | 16,076 | 11.6% |
[ 12.0% - 12.5% ] 12.44% | 10,743 | 13.1% |
[ 12.5% - 13.0% ] 12.77% | 9,407 | 14.4% |
[ 13.0% - 13.5% ] 13.12% | 5,837 | 13.1% |
[ 13.0% - 13.5% ] 13.49% | 13,530 | 11.8% |
[ 13.5% - 14.0% ] 13.86% | 2,049 | 20.8% |
[ 13.5% - 14.0% ] 13.99% | 26,671 | 11.9% |
[ 14.0% - 14.5% ] 14.42% | 10,048 | 14.3% |
[ 14.5% - 15.0% ] 14.72% | 6,332 | 15.8% |
[ 15.0% - 15.5% ] 15.05% | 12,641 | 9.7% |
[ 15.0% - 15.5% ] 15.26% | 3,991 | 11.6% |
[ 15.5% - 16.0% ] 15.60% | 20,101 | 14.5% |
[ 15.5% - 16.0% ] 15.86% | 4,060 | 14.1% |
[ 16.0% - 16.5% ] 16.06% | 965 | 19.7% |
[ 16.0% - 16.5% ] 16.50% | 1,558 | 16.8% |
[ 16.5% - 17.0% ] 16.87% | 5,051 | 12.2% |
[ 17.0% - 17.5% ] 17.27% | 5,624 | 11.4% |
[ 17.0% - 17.5% ] 17.50% | 3,103 | 21.0% |
[ 17.5% - 18.0% ] 17.71% | 7,113 | 10.3% |
[ 18.0% - 18.5% ] 18.04% | 7,688 | 13.3% |
[ 18.0% - 18.5% ] 18.33% | 6,613 | 13.0% |
[ 18.5% - 19.0% ] 18.62% | 1,391 | 24.2% |
[ 19.0% - 19.5% ] 19.09% | 330 | 19.9% |
[ 19.0% - 19.5% ] 19.30% | 2,243 | 8.3% |
[ 19.5% - 20.0% ] 19.56% | 2,086 | 15.3% |
[ 19.5% - 20.0% ] 19.94% | 351 | 16.6% |
[ 20.0% - 20.5% ] 20.23% | 2,027 | 15.4% |
[ 20.0% - 20.5% ] 20.49% | 7,012 | 10.2% |
[ 20.5% - 21.0% ] 20.91% | 1,889 | 16.1% |
[ 21.0% - 21.5% ] 21.16% | 7,901 | 9.9% |
[ 21.5% - 22.0% ] 21.66% | 2,105 | 10.1% |
[ 22.0% - 22.5% ] 22.07% | 743 | 18.2% |
[ 22.0% - 22.5% ] 22.28% | 7,132 | 13.3% |
[ 22.5% - 23.0% ] 22.72% | 471 | 12.7% |
[ 23.0% - 23.5% ] 23.08% | 1,300 | 17.6% |
[ 23.0% - 23.5% ] 23.29% | 73 | 32.4% |
[ 23.5% - 24.0% ] 23.55% | 9,075 | 18.6% |
[ 24.0% - 24.5% ] 24.26% | 878 | 21.1% |
[ 24.5% - 25.0% ] 24.62% | 1,653 | 18.7% |
[ 24.5% - 25.0% ] 24.90% | 510 | 14.3% |
[ 25.0% - 25.5% ] 25.22% | 4,037 | 12.2% |
[ 25.0% - 25.5% ] 25.41% | 181 | 27.5% |
[ 25.5% - 26.0% ] 25.84% | 1,676 | 13.0% |
[ 26.5% - 27.0% ] 26.59% | 425 | 39.2% |
[ 26.5% - 27.0% ] 26.89% | 212 | 5.2% |
[ 27.0% - 27.5% ] 27.41% | 321 | 2.7% |
[ 27.5% - 28.0% ] 27.72% | 2,244 | 16.6% |
[ 28.0% - 28.5% ] 28.40% | 514 | 28.5% |
[ 28.5% - 29.0% ] 28.51% | 7,766 | 15.5% |
[ 28.5% - 29.0% ] 28.81% | 236 | 11.0% |
[ 29.0% - 29.5% ] 29.29% | 99 | 45.5% |
[ 29.5% - 30.0% ] 29.76% | 1,929 | 13.8% |
[ 30.0% - 30.5% ] 30.19% | 5,088 | 14.6% |
[ 30.0% - 30.5% ] 30.38% | 609 | 20.8% |
[ 30.5% - 31.0% ] 30.72% | 1,605 | 15.3% |
[ 31.0% - 31.5% ] 31.44% | 776 | 18.6% |
[ 31.5% - 32.0% ] 31.58% | 361 | 6.0% |
[ 32.0% - 32.5% ] 32.00% | 75 | 23.7% |
[ 32.5% - 33.0% ] 32.94% | 513 | 21.6% |
[ 33.0% - 33.5% ] 33.33% | 183 | 11.6% |
[ 33.0% - 33.5% ] 33.48% | 1,643 | 13.6% |
[ 33.5% - 34.0% ] 33.71% | 5,443 | 14.6% |
[ 34.0% - 34.5% ] 34.17% | 120 | 35.3% |
[ 34.0% - 34.5% ] 34.31% | 204 | 29.4% |
[ 35.5% - 36.0% ] 35.60% | 663 | 20.7% |
[ 35.5% - 36.0% ] 35.97% | 620 | 23.5% |
[ 36.0% - 36.5% ] 36.14% | 166 | 1.8% |
[ 37.0% - 37.5% ] 37.03% | 1,345 | 13.1% |
[ 37.0% - 37.5% ] 37.45% | 275 | 19.6% |
[ 38.0% - 38.5% ] 38.37% | 86 | 2.5% |
[ 39.0% - 39.5% ] 39.14% | 350 | 10.7% |
[ 39.5% - 40.0% ] 39.95% | 2,095 | 13.8% |
[ 40.5% - 41.0% ] 40.59% | 2,237 | 15.4% |
[ 40.5% - 41.0% ] 40.87% | 115 | 17.2% |
[ 42.0% - 42.5% ] 42.07% | 290 | 26.0% |
[ 42.5% - 43.0% ] 42.83% | 635 | 18.7% |
[ 43.5% - 44.0% ] 43.97% | 630 | 13.0% |
[ 45.0% - 45.5% ] 45.29% | 616 | 7.3% |
[ 45.5% - 46.0% ] 45.66% | 679 | 10.4% |
[ 45.5% - 46.0% ] 45.90% | 427 | 11.7% |
[ 46.5% - 47.0% ] 46.81% | 376 | 17.7% |
[ 47.0% - 47.5% ] 47.46% | 118 | 26.7% |
[ 48.0% - 48.5% ] 48.09% | 601 | 10.6% |
[ 48.0% - 48.5% ] 48.25% | 342 | 7.9% |
[ 48.0% - 48.5% ] 48.49% | 365 | 7.2% |
[ 49.5% - 50.0% ] 49.54% | 109 | 45.8% |
[ 52.5% - 53.0% ] 52.57% | 253 | 6.3% |
[ 55.0% - 55.5% ] 55.38% | 251 | 9.8% |
[ 56.0% - 56.5% ] 56.39% | 454 | 13.2% |
[ 57.5% - 58.0% ] 57.78% | 135 | 16.2% |
[ 59.0% - 59.5% ] 59.09% | 44 | 6.7% |
[ 60.5% - 61.0% ] 60.71% | 56 | 4.8% |
[ 60.5% - 61.0% ] 60.90% | 335 | 38.9% |