Czech Disability Age Under 5
COMPARE
Czech
Select to Compare
Disability Age Under 5
Czech Disability Age Under 5
1.5%
DISABILITY | AGE UNDER 5
0.0/ 100
METRIC RATING
290th/ 347
METRIC RANK
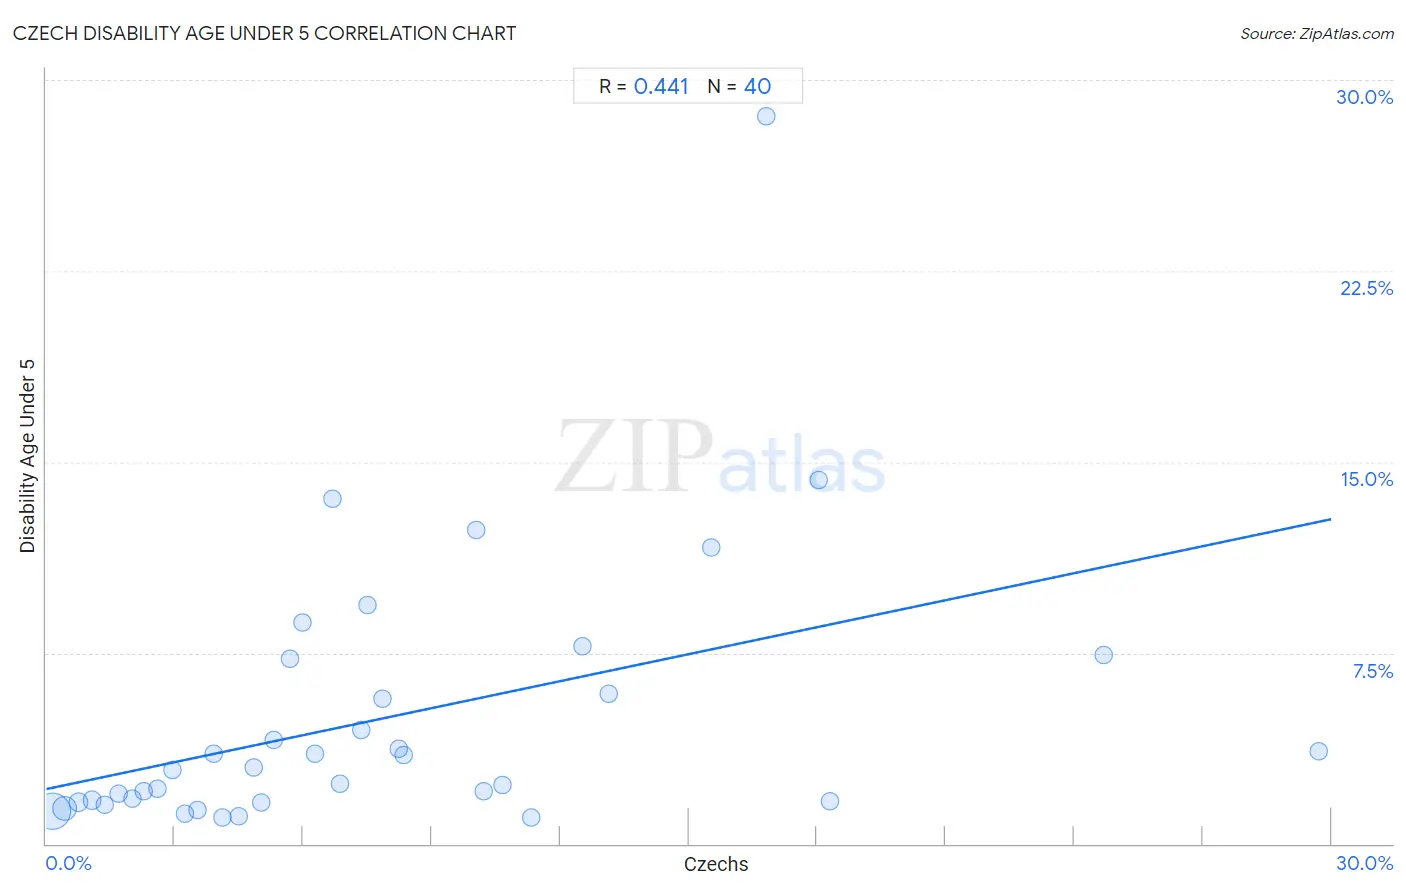
Czech Disability Age Under 5 Correlation Chart
The statistical analysis conducted on geographies consisting of 237,038,678 people shows a moderate positive correlation between the proportion of Czechs and percentage of population with a disability under the age of 5 in the United States with a correlation coefficient (R) of 0.441 and weighted average of 1.5%. On average, for every 1% (one percent) increase in Czechs within a typical geography, there is an increase of 0.35% in percentage of population with a disability under the age of 5.
It is essential to understand that the correlation between the percentage of Czechs and percentage of population with a disability under the age of 5 does not imply a direct cause-and-effect relationship. It remains uncertain whether the presence of Czechs influences an upward or downward trend in the level of percentage of population with a disability under the age of 5 within an area, or if Czechs simply ended up residing in those areas with higher or lower levels of percentage of population with a disability under the age of 5 due to other factors.
Demographics Similar to Czechs by Disability Age Under 5
In terms of disability age under 5, the demographic groups most similar to Czechs are Northern European (1.6%, a difference of 0.10%), Hungarian (1.5%, a difference of 0.13%), Italian (1.6%, a difference of 0.24%), Estonian (1.5%, a difference of 0.26%), and Scandinavian (1.5%, a difference of 0.45%).
| Demographics | Rating | Rank | Disability Age Under 5 |
| Delaware | 0.0 /100 | #283 | Tragic 1.5% |
| Europeans | 0.0 /100 | #284 | Tragic 1.5% |
| Croatians | 0.0 /100 | #285 | Tragic 1.5% |
| Tlingit-Haida | 0.0 /100 | #286 | Tragic 1.5% |
| Scandinavians | 0.0 /100 | #287 | Tragic 1.5% |
| Estonians | 0.0 /100 | #288 | Tragic 1.5% |
| Hungarians | 0.0 /100 | #289 | Tragic 1.5% |
| Czechs | 0.0 /100 | #290 | Tragic 1.5% |
| Northern Europeans | 0.0 /100 | #291 | Tragic 1.6% |
| Italians | 0.0 /100 | #292 | Tragic 1.6% |
| Lithuanians | 0.0 /100 | #293 | Tragic 1.6% |
| Swedes | 0.0 /100 | #294 | Tragic 1.6% |
| Finns | 0.0 /100 | #295 | Tragic 1.6% |
| Poles | 0.0 /100 | #296 | Tragic 1.6% |
| Nonimmigrants | 0.0 /100 | #297 | Tragic 1.6% |
Czech Disability Age Under 5 Correlation Summary
| Measurement | Czech Data | Disability Age Under 5 Data |
| Minimum | 0.15% | 1.0% |
| Maximum | 29.7% | 28.6% |
| Range | 29.5% | 27.5% |
| Mean | 7.8% | 4.9% |
| Median | 6.1% | 2.9% |
| Interquartile 25% (IQ1) | 3.1% | 1.7% |
| Interquartile 75% (IQ3) | 10.4% | 6.6% |
| Interquartile Range (IQR) | 7.3% | 4.9% |
| Standard Deviation (Sample) | 6.6% | 5.3% |
| Standard Deviation (Population) | 6.6% | 5.2% |
Correlation Details
| Czech Percentile | Sample Size | Disability Age Under 5 |
[ 0.0% - 0.5% ] 0.15% | 149,735,359 | 1.3% |
[ 0.0% - 0.5% ] 0.43% | 55,851,889 | 1.4% |
[ 0.5% - 1.0% ] 0.75% | 13,988,747 | 1.6% |
[ 1.0% - 1.5% ] 1.07% | 6,775,669 | 1.7% |
[ 1.0% - 1.5% ] 1.37% | 3,939,451 | 1.5% |
[ 1.5% - 2.0% ] 1.69% | 2,012,923 | 2.0% |
[ 2.0% - 2.5% ] 2.01% | 1,367,125 | 1.8% |
[ 2.0% - 2.5% ] 2.29% | 500,818 | 2.0% |
[ 2.5% - 3.0% ] 2.61% | 540,388 | 2.2% |
[ 2.5% - 3.0% ] 2.95% | 353,581 | 2.9% |
[ 3.0% - 3.5% ] 3.24% | 672,760 | 1.2% |
[ 3.5% - 4.0% ] 3.53% | 94,142 | 1.3% |
[ 3.5% - 4.0% ] 3.91% | 97,498 | 3.5% |
[ 4.0% - 4.5% ] 4.12% | 391,748 | 1.0% |
[ 4.5% - 5.0% ] 4.50% | 325,279 | 1.1% |
[ 4.5% - 5.0% ] 4.83% | 59,570 | 3.0% |
[ 5.0% - 5.5% ] 5.03% | 149,313 | 1.6% |
[ 5.0% - 5.5% ] 5.33% | 20,787 | 4.1% |
[ 5.5% - 6.0% ] 5.68% | 5,155 | 7.3% |
[ 5.5% - 6.0% ] 5.98% | 10,378 | 8.7% |
[ 6.0% - 6.5% ] 6.29% | 11,643 | 3.6% |
[ 6.5% - 7.0% ] 6.70% | 1,538 | 13.5% |
[ 6.5% - 7.0% ] 6.87% | 16,868 | 2.3% |
[ 7.0% - 7.5% ] 7.35% | 33,795 | 4.5% |
[ 7.5% - 8.0% ] 7.51% | 1,132 | 9.4% |
[ 7.5% - 8.0% ] 7.84% | 14,840 | 5.7% |
[ 8.0% - 8.5% ] 8.24% | 41,058 | 3.7% |
[ 8.0% - 8.5% ] 8.35% | 4,273 | 3.5% |
[ 10.0% - 10.5% ] 10.03% | 2,362 | 12.3% |
[ 10.0% - 10.5% ] 10.23% | 1,242 | 2.1% |
[ 10.5% - 11.0% ] 10.64% | 2,679 | 2.3% |
[ 11.0% - 11.5% ] 11.31% | 3,916 | 1.0% |
[ 12.5% - 13.0% ] 12.53% | 1,636 | 7.8% |
[ 13.0% - 13.5% ] 13.12% | 1,021 | 5.9% |
[ 15.5% - 16.0% ] 15.54% | 1,345 | 11.6% |
[ 16.5% - 17.0% ] 16.80% | 256 | 28.6% |
[ 18.0% - 18.5% ] 18.05% | 133 | 14.3% |
[ 18.0% - 18.5% ] 18.29% | 5,067 | 1.7% |
[ 24.5% - 25.0% ] 24.69% | 405 | 7.4% |
[ 29.5% - 30.0% ] 29.70% | 889 | 3.6% |