Czech Self-Care Disability
COMPARE
Czech
Select to Compare
Self-Care Disability
Czech Self-Care Disability
2.3%
SELF-CARE DISABILITY
99.8/ 100
METRIC RATING
46th/ 347
METRIC RANK
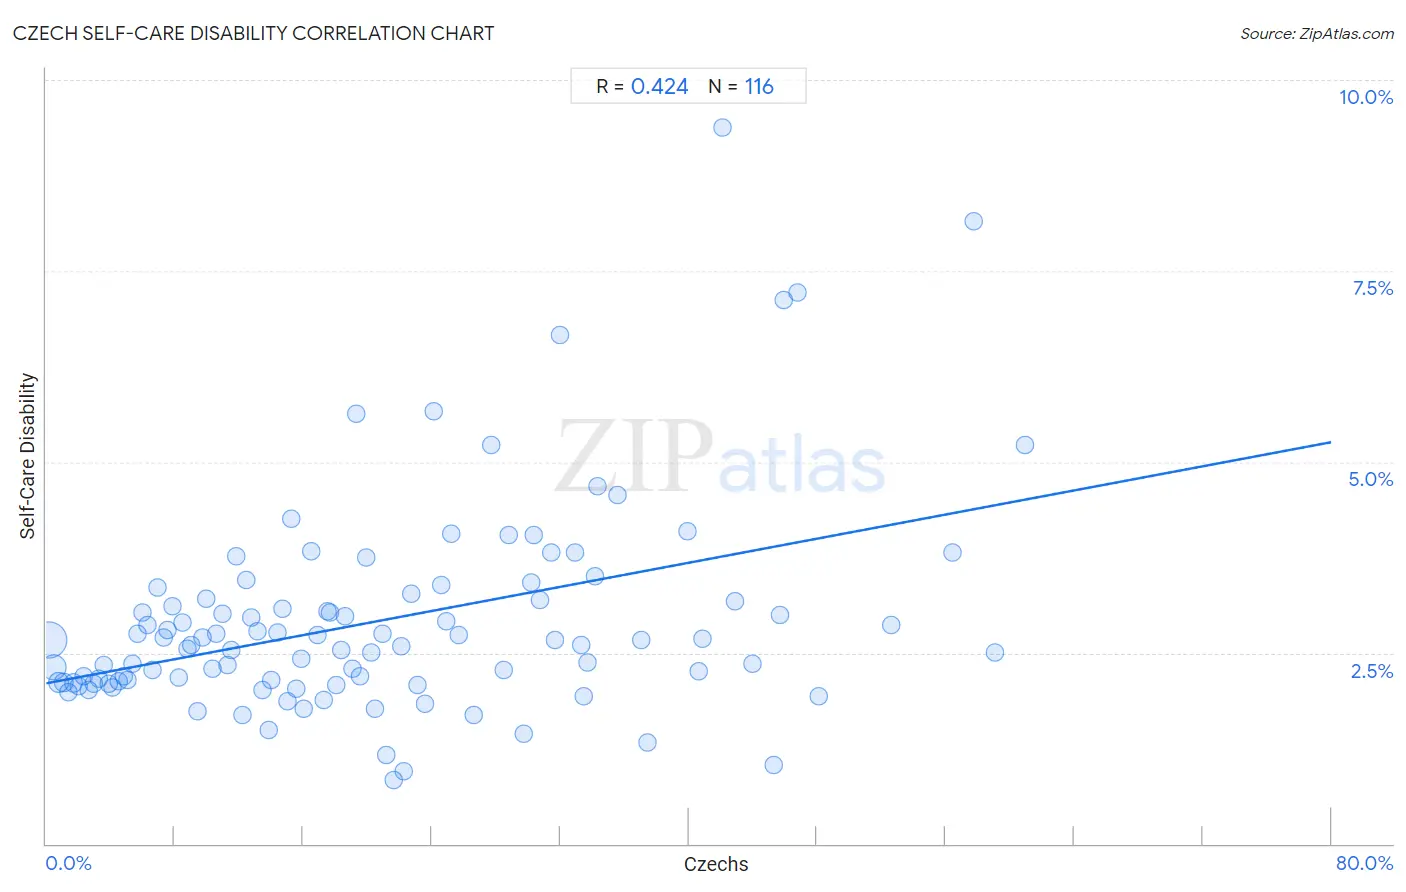
Czech Self-Care Disability Correlation Chart
The statistical analysis conducted on geographies consisting of 483,678,458 people shows a moderate positive correlation between the proportion of Czechs and percentage of population with self-care disability in the United States with a correlation coefficient (R) of 0.424 and weighted average of 2.3%. On average, for every 1% (one percent) increase in Czechs within a typical geography, there is an increase of 0.039% in percentage of population with self-care disability.
It is essential to understand that the correlation between the percentage of Czechs and percentage of population with self-care disability does not imply a direct cause-and-effect relationship. It remains uncertain whether the presence of Czechs influences an upward or downward trend in the level of percentage of population with self-care disability within an area, or if Czechs simply ended up residing in those areas with higher or lower levels of percentage of population with self-care disability due to other factors.
Demographics Similar to Czechs by Self-Care Disability
In terms of self-care disability, the demographic groups most similar to Czechs are Norwegian (2.3%, a difference of 0.080%), Immigrants from South Africa (2.3%, a difference of 0.13%), Immigrants from Pakistan (2.3%, a difference of 0.17%), Immigrants from Uganda (2.3%, a difference of 0.22%), and Jordanian (2.3%, a difference of 0.23%).
| Demographics | Rating | Rank | Self-Care Disability |
| Immigrants from Bulgaria | 99.8 /100 | #39 | Exceptional 2.3% |
| Iranians | 99.8 /100 | #40 | Exceptional 2.3% |
| Immigrants from Sudan | 99.8 /100 | #41 | Exceptional 2.3% |
| Immigrants from Uganda | 99.8 /100 | #42 | Exceptional 2.3% |
| Immigrants from Pakistan | 99.8 /100 | #43 | Exceptional 2.3% |
| Immigrants from South Africa | 99.8 /100 | #44 | Exceptional 2.3% |
| Norwegians | 99.8 /100 | #45 | Exceptional 2.3% |
| Czechs | 99.8 /100 | #46 | Exceptional 2.3% |
| Jordanians | 99.7 /100 | #47 | Exceptional 2.3% |
| Immigrants from Malaysia | 99.7 /100 | #48 | Exceptional 2.3% |
| Latvians | 99.7 /100 | #49 | Exceptional 2.3% |
| Immigrants from Brazil | 99.7 /100 | #50 | Exceptional 2.3% |
| Kenyans | 99.7 /100 | #51 | Exceptional 2.3% |
| Immigrants from Serbia | 99.6 /100 | #52 | Exceptional 2.3% |
| Australians | 99.6 /100 | #53 | Exceptional 2.3% |
Czech Self-Care Disability Correlation Summary
| Measurement | Czech Data | Self-Care Disability Data |
| Minimum | 0.15% | 0.83% |
| Maximum | 60.9% | 9.4% |
| Range | 60.7% | 8.5% |
| Mean | 20.7% | 2.9% |
| Median | 17.9% | 2.6% |
| Interquartile 25% (IQ1) | 8.9% | 2.1% |
| Interquartile 75% (IQ3) | 30.5% | 3.2% |
| Interquartile Range (IQR) | 21.6% | 1.1% |
| Standard Deviation (Sample) | 14.8% | 1.4% |
| Standard Deviation (Population) | 14.7% | 1.4% |
Correlation Details
| Czech Percentile | Sample Size | Self-Care Disability |
[ 0.0% - 0.5% ] 0.15% | 277,582,428 | 2.7% |
[ 0.0% - 0.5% ] 0.43% | 115,831,725 | 2.3% |
[ 0.5% - 1.0% ] 0.75% | 39,242,353 | 2.1% |
[ 1.0% - 1.5% ] 1.06% | 19,076,907 | 2.1% |
[ 1.0% - 1.5% ] 1.38% | 10,663,655 | 2.0% |
[ 1.5% - 2.0% ] 1.69% | 6,460,567 | 2.1% |
[ 2.0% - 2.5% ] 2.00% | 4,053,354 | 2.1% |
[ 2.0% - 2.5% ] 2.30% | 2,162,696 | 2.2% |
[ 2.5% - 3.0% ] 2.61% | 1,634,157 | 2.0% |
[ 2.5% - 3.0% ] 2.92% | 1,144,764 | 2.1% |
[ 3.0% - 3.5% ] 3.23% | 1,288,236 | 2.2% |
[ 3.5% - 4.0% ] 3.55% | 596,882 | 2.3% |
[ 3.5% - 4.0% ] 3.88% | 419,999 | 2.1% |
[ 4.0% - 4.5% ] 4.13% | 604,693 | 2.0% |
[ 4.0% - 4.5% ] 4.49% | 622,893 | 2.1% |
[ 4.5% - 5.0% ] 4.79% | 456,944 | 2.2% |
[ 5.0% - 5.5% ] 5.06% | 308,550 | 2.1% |
[ 5.0% - 5.5% ] 5.36% | 269,017 | 2.4% |
[ 5.5% - 6.0% ] 5.65% | 87,381 | 2.7% |
[ 5.5% - 6.0% ] 6.00% | 93,098 | 3.0% |
[ 6.0% - 6.5% ] 6.30% | 74,278 | 2.9% |
[ 6.5% - 7.0% ] 6.62% | 127,716 | 2.3% |
[ 6.5% - 7.0% ] 6.96% | 67,698 | 3.4% |
[ 7.0% - 7.5% ] 7.32% | 75,053 | 2.7% |
[ 7.5% - 8.0% ] 7.55% | 72,032 | 2.8% |
[ 7.5% - 8.0% ] 7.84% | 66,505 | 3.1% |
[ 8.0% - 8.5% ] 8.23% | 64,631 | 2.2% |
[ 8.0% - 8.5% ] 8.46% | 46,272 | 2.9% |
[ 8.5% - 9.0% ] 8.81% | 31,950 | 2.5% |
[ 9.0% - 9.5% ] 9.06% | 14,616 | 2.6% |
[ 9.0% - 9.5% ] 9.39% | 12,353 | 1.7% |
[ 9.5% - 10.0% ] 9.70% | 22,961 | 2.7% |
[ 9.5% - 10.0% ] 9.98% | 20,890 | 3.2% |
[ 10.0% - 10.5% ] 10.35% | 27,798 | 2.3% |
[ 10.5% - 11.0% ] 10.61% | 11,797 | 2.7% |
[ 10.5% - 11.0% ] 10.96% | 34,640 | 3.0% |
[ 11.0% - 11.5% ] 11.26% | 31,678 | 2.3% |
[ 11.5% - 12.0% ] 11.54% | 9,496 | 2.5% |
[ 11.5% - 12.0% ] 11.86% | 6,046 | 3.8% |
[ 12.0% - 12.5% ] 12.19% | 14,163 | 1.7% |
[ 12.0% - 12.5% ] 12.44% | 10,807 | 3.4% |
[ 12.5% - 13.0% ] 12.77% | 9,186 | 3.0% |
[ 13.0% - 13.5% ] 13.14% | 3,752 | 2.8% |
[ 13.0% - 13.5% ] 13.49% | 13,141 | 2.0% |
[ 13.5% - 14.0% ] 13.86% | 2,049 | 1.5% |
[ 13.5% - 14.0% ] 13.99% | 26,262 | 2.1% |
[ 14.0% - 14.5% ] 14.42% | 9,687 | 2.8% |
[ 14.5% - 15.0% ] 14.72% | 6,332 | 3.1% |
[ 15.0% - 15.5% ] 15.05% | 12,567 | 1.9% |
[ 15.0% - 15.5% ] 15.29% | 2,839 | 4.3% |
[ 15.5% - 16.0% ] 15.60% | 19,922 | 2.0% |
[ 15.5% - 16.0% ] 15.85% | 3,338 | 2.4% |
[ 16.0% - 16.5% ] 16.06% | 965 | 1.8% |
[ 16.0% - 16.5% ] 16.49% | 1,346 | 3.8% |
[ 16.5% - 17.0% ] 16.88% | 4,645 | 2.7% |
[ 17.0% - 17.5% ] 17.27% | 5,483 | 1.9% |
[ 17.0% - 17.5% ] 17.50% | 2,955 | 3.0% |
[ 17.5% - 18.0% ] 17.70% | 6,429 | 3.0% |
[ 18.0% - 18.5% ] 18.04% | 7,382 | 2.1% |
[ 18.0% - 18.5% ] 18.33% | 6,542 | 2.5% |
[ 18.5% - 19.0% ] 18.62% | 1,391 | 3.0% |
[ 19.0% - 19.5% ] 19.07% | 215 | 2.3% |
[ 19.0% - 19.5% ] 19.30% | 2,150 | 5.6% |
[ 19.5% - 20.0% ] 19.56% | 2,086 | 2.2% |
[ 19.5% - 20.0% ] 19.94% | 321 | 3.7% |
[ 20.0% - 20.5% ] 20.26% | 1,096 | 2.5% |
[ 20.0% - 20.5% ] 20.49% | 6,880 | 1.8% |
[ 20.5% - 21.0% ] 20.91% | 1,889 | 2.8% |
[ 21.0% - 21.5% ] 21.16% | 7,901 | 1.2% |
[ 21.5% - 22.0% ] 21.66% | 1,967 | 0.83% |
[ 22.0% - 22.5% ] 22.07% | 675 | 2.6% |
[ 22.0% - 22.5% ] 22.27% | 6,605 | 0.94% |
[ 22.5% - 23.0% ] 22.72% | 471 | 3.3% |
[ 23.0% - 23.5% ] 23.08% | 1,300 | 2.1% |
[ 23.5% - 24.0% ] 23.55% | 9,037 | 1.8% |
[ 24.0% - 24.5% ] 24.15% | 381 | 5.7% |
[ 24.5% - 25.0% ] 24.62% | 1,653 | 3.4% |
[ 24.5% - 25.0% ] 24.90% | 510 | 2.9% |
[ 25.0% - 25.5% ] 25.22% | 4,037 | 4.1% |
[ 25.5% - 26.0% ] 25.69% | 432 | 2.7% |
[ 26.5% - 27.0% ] 26.58% | 237 | 1.7% |
[ 27.5% - 28.0% ] 27.72% | 2,244 | 5.2% |
[ 28.5% - 29.0% ] 28.51% | 7,766 | 2.3% |
[ 28.5% - 29.0% ] 28.80% | 184 | 4.0% |
[ 29.5% - 30.0% ] 29.74% | 1,318 | 1.4% |
[ 30.0% - 30.5% ] 30.19% | 5,088 | 3.4% |
[ 30.0% - 30.5% ] 30.38% | 609 | 4.0% |
[ 30.5% - 31.0% ] 30.72% | 1,605 | 3.2% |
[ 31.0% - 31.5% ] 31.45% | 477 | 3.8% |
[ 31.5% - 32.0% ] 31.65% | 79 | 2.7% |
[ 32.0% - 32.5% ] 32.00% | 75 | 6.7% |
[ 32.5% - 33.0% ] 32.94% | 513 | 3.8% |
[ 33.0% - 33.5% ] 33.33% | 81 | 2.6% |
[ 33.0% - 33.5% ] 33.48% | 1,643 | 1.9% |
[ 33.5% - 34.0% ] 33.71% | 5,443 | 2.4% |
[ 34.0% - 34.5% ] 34.17% | 120 | 3.5% |
[ 34.0% - 34.5% ] 34.31% | 204 | 4.7% |
[ 35.5% - 36.0% ] 35.60% | 663 | 4.6% |
[ 37.0% - 37.5% ] 37.03% | 1,345 | 2.7% |
[ 37.0% - 37.5% ] 37.45% | 275 | 1.3% |
[ 39.5% - 40.0% ] 39.95% | 2,095 | 4.1% |
[ 40.5% - 41.0% ] 40.59% | 2,237 | 2.3% |
[ 40.5% - 41.0% ] 40.87% | 115 | 2.7% |
[ 42.0% - 42.5% ] 42.07% | 290 | 9.4% |
[ 42.5% - 43.0% ] 42.86% | 210 | 3.2% |
[ 43.5% - 44.0% ] 43.97% | 630 | 2.4% |
[ 45.0% - 45.5% ] 45.29% | 616 | 1.0% |
[ 45.5% - 46.0% ] 45.70% | 221 | 3.0% |
[ 45.5% - 46.0% ] 45.90% | 427 | 7.1% |
[ 46.5% - 47.0% ] 46.81% | 376 | 7.2% |
[ 48.0% - 48.5% ] 48.10% | 553 | 1.9% |
[ 52.5% - 53.0% ] 52.57% | 253 | 2.9% |
[ 56.0% - 56.5% ] 56.39% | 454 | 3.8% |
[ 57.5% - 58.0% ] 57.78% | 135 | 8.1% |
[ 59.0% - 59.5% ] 59.09% | 44 | 2.5% |
[ 60.5% - 61.0% ] 60.90% | 335 | 5.2% |