Czech Unemployment Among Women with Children Ages 6 to 17 years

COMPARE

Czech
Race
Ancestry
AfghanAfricanAlaska NativeAlaskan AthabascanAlbanianAleutAlsatianAmericanApacheArabArapahoArgentineanArmenianAssyrian/Chaldean/SyriacAustralianAustrianBahamianBangladeshiBarbadianBasqueBelgianBelizeanBermudanBhutaneseBlackfeetBolivianBrazilianBritishBritish West IndianBulgarianBurmeseCajunCambodianCanadianCape VerdeanCarpatho RusynCelticCentral AmericanCentral American IndianCherokeeCheyenneChickasawChileanChineseChippewaChoctawColombianColvilleComancheCosta RicanCreeCreekCroatianCrowCubanCypriotCzechCzechoslovakianDanishDelawareDominicanDutchDutch West IndianEastern EuropeanEcuadorianEgyptianEnglishEstonianEthiopianEuropeanFijianFilipinoFinnishFrenchFrench American IndianFrench CanadianGermanGerman RussianGhanaianGreekGuamanian/ChamorroGuatemalanGuyaneseHaitianHmongHonduranHopiHoumaHungarianIcelanderIndian (Asian)IndonesianInupiatIranianIraqiIrishIroquoisIsraeliItalianJamaicanJapaneseJordanianKenyanKiowaKoreanLaotianLatvianLebaneseLiberianLithuanianLumbeeLuxembourgerMacedonianMalaysianMalteseMarshalleseMenomineeMexicanMexican American IndianMongolianMoroccanNative HawaiianNavajoNepaleseNew ZealanderNicaraguanNigerianNorthern EuropeanNorwegianOkinawanOsageOttawaPaiutePakistaniPalestinianPanamanianParaguayanPennsylvania GermanPeruvianPimaPolishPortuguesePotawatomiPuebloPuerto RicanPuget Sound SalishRomanianRussianSalvadoranSamoanScandinavianScotch-IrishScottishSeminoleSenegaleseSerbianShoshoneSierra LeoneanSiouxSlavicSlovakSloveneSomaliSouth AfricanSouth AmericanSouth American IndianSoviet UnionSpaniardSpanishSpanish AmericanSpanish American IndianSri LankanSubsaharan AfricanSudaneseSwedishSwissSyrianTaiwaneseThaiTlingit-HaidaTohono O'OdhamTonganTrinidadian and TobagonianTsimshianTurkishU.S. Virgin IslanderUgandanUkrainianUruguayanUteVenezuelanVietnameseWelshWest IndianYakamaYaquiYugoslavianYumanYup'ikZimbabwean
Immigration
NonimmigrantsImmigrantsAfghanistanAfricaAlbaniaArgentinaArmeniaAsiaAustraliaAustriaBahamasBangladeshBarbadosBelarusBelgiumBelizeBoliviaBosnia and HerzegovinaBrazilBulgariaBurma/MyanmarCabo VerdeCambodiaCameroonCanadaCaribbeanCentral AmericaChileChinaColombiaCongoCosta RicaCroatiaCubaCzechoslovakiaDenmarkDominicaDominican RepublicEastern AfricaEastern AsiaEastern EuropeEcuadorEgyptEl SalvadorEnglandEritreaEthiopiaEuropeFijiFranceGermanyGhanaGreeceGrenadaGuatemalaGuyanaHaitiHondurasHong KongHungaryIndiaIndonesiaIranIraqIrelandIsraelItalyJamaicaJapanJordanKazakhstanKenyaKoreaKuwaitLaosLatin AmericaLatviaLebanonLiberiaLithuaniaMalaysiaMexicoMicronesiaMiddle AfricaMoldovaMoroccoNepalNetherlandsNicaraguaNigeriaNorth AmericaNorth MacedoniaNorthern AfricaNorthern EuropeNorwayOceaniaPakistanPanamaPeruPhilippinesPolandPortugalRomaniaRussiaSaudi ArabiaScotlandSenegalSerbiaSierra LeoneSingaporeSomaliaSouth AfricaSouth AmericaSouth Central AsiaSouth Eastern AsiaSouthern EuropeSpainSri LankaSt. Vincent and the GrenadinesSudanSwedenSwitzerlandSyriaTaiwanThailandTrinidad and TobagoTurkeyUgandaUkraineUruguayUzbekistanVenezuelaVietnamWest IndiesWestern AfricaWestern AsiaWestern EuropeYemenZaireZimbabweAzores
Select to Compare
Race
Ancestry
AfghanAfricanAlaska NativeAlaskan AthabascanAlbanianAleutAlsatianAmericanApacheArabArapahoArgentineanArmenianAssyrian/Chaldean/SyriacAustralianAustrianBahamianBangladeshiBarbadianBasqueBelgianBelizeanBermudanBhutaneseBlackfeetBolivianBrazilianBritishBritish West IndianBulgarianBurmeseCajunCambodianCanadianCape VerdeanCarpatho RusynCelticCentral AmericanCentral American IndianCherokeeCheyenneChickasawChileanChineseChippewaChoctawColombianColvilleComancheCosta RicanCreeCreekCroatianCrowCubanCypriotCzechoslovakianDanishDelawareDominicanDutchDutch West IndianEastern EuropeanEcuadorianEgyptianEnglishEstonianEthiopianEuropeanFijianFilipinoFinnishFrenchFrench American IndianFrench CanadianGermanGerman RussianGhanaianGreekGuamanian/ChamorroGuatemalanGuyaneseHaitianHmongHonduranHopiHoumaHungarianIcelanderIndian (Asian)IndonesianInupiatIranianIraqiIrishIroquoisIsraeliItalianJamaicanJapaneseJordanianKenyanKiowaKoreanLaotianLatvianLebaneseLiberianLithuanianLumbeeLuxembourgerMacedonianMalaysianMalteseMarshalleseMenomineeMexicanMexican American IndianMongolianMoroccanNative HawaiianNavajoNepaleseNew ZealanderNicaraguanNigerianNorthern EuropeanNorwegianOkinawanOsageOttawaPaiutePakistaniPalestinianPanamanianParaguayanPennsylvania GermanPeruvianPimaPolishPortuguesePotawatomiPuebloPuerto RicanPuget Sound SalishRomanianRussianSalvadoranSamoanScandinavianScotch-IrishScottishSeminoleSenegaleseSerbianShoshoneSierra LeoneanSiouxSlavicSlovakSloveneSomaliSouth AfricanSouth AmericanSouth American IndianSoviet UnionSpaniardSpanishSpanish AmericanSpanish American IndianSri LankanSubsaharan AfricanSudaneseSwedishSwissSyrianTaiwaneseThaiTlingit-HaidaTohono O'OdhamTonganTrinidadian and TobagonianTsimshianTurkishU.S. Virgin IslanderUgandanUkrainianUruguayanUteVenezuelanVietnameseWelshWest IndianYakamaYaquiYugoslavianYumanYup'ikZimbabwean
Immigration
NonimmigrantsImmigrantsAfghanistanAfricaAlbaniaArgentinaArmeniaAsiaAustraliaAustriaBahamasBangladeshBarbadosBelarusBelgiumBelizeBoliviaBosnia and HerzegovinaBrazilBulgariaBurma/MyanmarCabo VerdeCambodiaCameroonCanadaCaribbeanCentral AmericaChileChinaColombiaCongoCosta RicaCroatiaCubaCzechoslovakiaDenmarkDominicaDominican RepublicEastern AfricaEastern AsiaEastern EuropeEcuadorEgyptEl SalvadorEnglandEritreaEthiopiaEuropeFijiFranceGermanyGhanaGreeceGrenadaGuatemalaGuyanaHaitiHondurasHong KongHungaryIndiaIndonesiaIranIraqIrelandIsraelItalyJamaicaJapanJordanKazakhstanKenyaKoreaKuwaitLaosLatin AmericaLatviaLebanonLiberiaLithuaniaMalaysiaMexicoMicronesiaMiddle AfricaMoldovaMoroccoNepalNetherlandsNicaraguaNigeriaNorth AmericaNorth MacedoniaNorthern AfricaNorthern EuropeNorwayOceaniaPakistanPanamaPeruPhilippinesPolandPortugalRomaniaRussiaSaudi ArabiaScotlandSenegalSerbiaSierra LeoneSingaporeSomaliaSouth AfricaSouth AmericaSouth Central AsiaSouth Eastern AsiaSouthern EuropeSpainSri LankaSt. Vincent and the GrenadinesSudanSwedenSwitzerlandSyriaTaiwanThailandTrinidad and TobagoTurkeyUgandaUkraineUruguayUzbekistanVenezuelaVietnamWest IndiesWestern AfricaWestern AsiaWestern EuropeYemenZaireZimbabweAzores
Unemployment Among Women with Children Ages 6 to 17 years
Income
Poverty
Unemployment
Labor Participation
Family Structure
Vehicle Availability
Education Level
Disability

Czech Unemployment Among Women with Children Ages 6 to 17 years
Exceptional

8.7%
UNEMPLOYMENT | WOMEN W/ CHILDREN 6 TO 17
94.4/ 100
METRIC RATING
127th/ 347
METRIC RANK

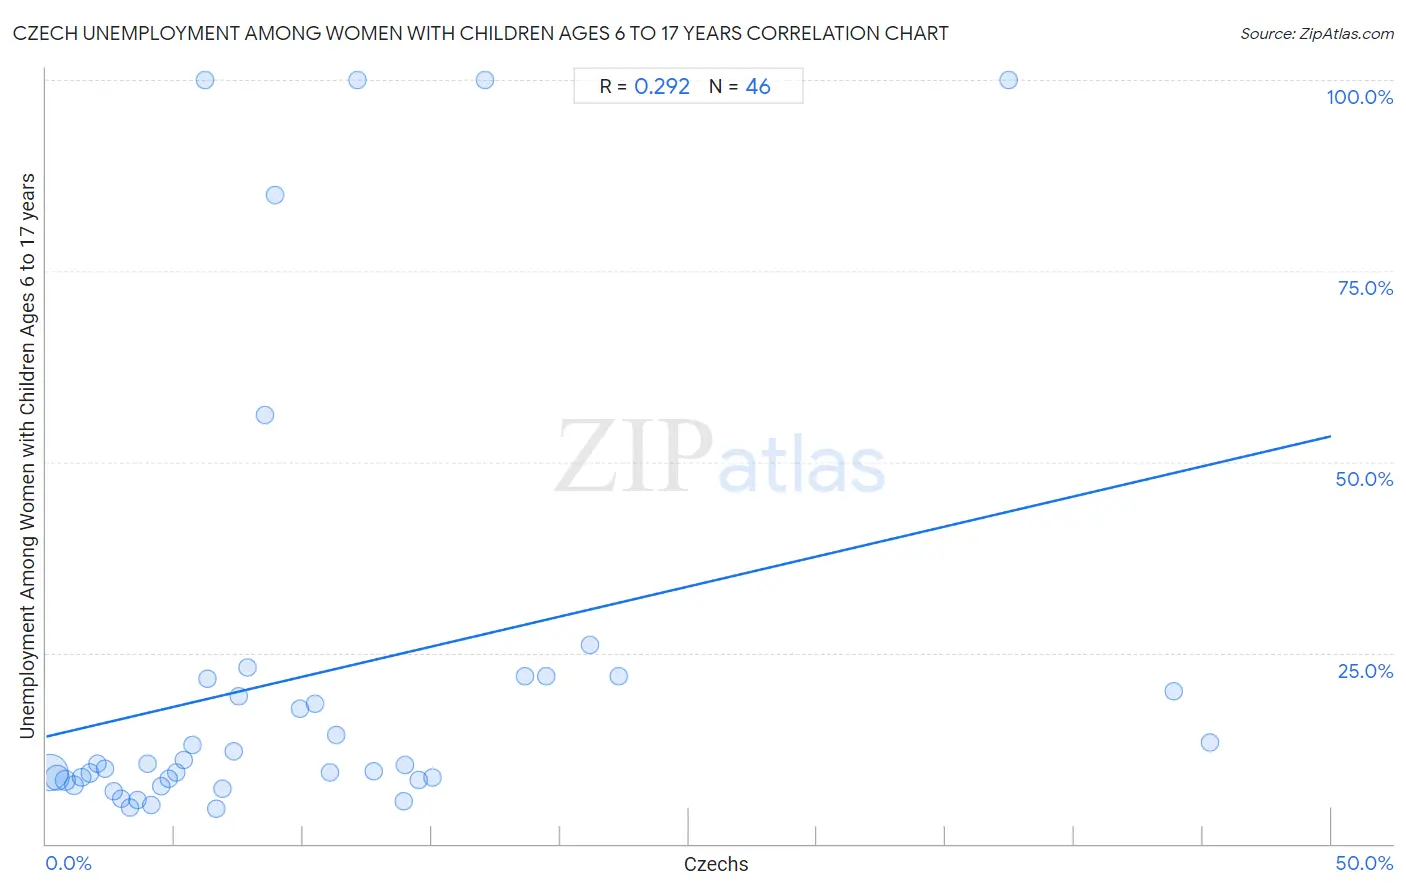
Czech Unemployment Among Women with Children Ages 6 to 17 years Correlation Chart

The statistical analysis conducted on geographies consisting of 319,576,456 people shows a weak positive correlation between the proportion of Czechs and unemployment rate among women with children between the ages 6 and 17 in the United States with a correlation coefficient (R) of 0.292 and weighted average of 8.7%. On average, for every 1% (one percent) increase in Czechs within a typical geography, there is an increase of 0.79% in unemployment rate among women with children between the ages 6 and 17.
Czech Unemployment Among Women with Children Ages 6 to 17 years
It is essential to understand that the correlation between the percentage of Czechs and unemployment rate among women with children between the ages 6 and 17 does not imply a direct cause-and-effect relationship. It remains uncertain whether the presence of Czechs influences an upward or downward trend in the level of unemployment rate among women with children between the ages 6 and 17 within an area, or if Czechs simply ended up residing in those areas with higher or lower levels of unemployment rate among women with children between the ages 6 and 17 due to other factors.

Demographics Similar to Czechs by Unemployment Among Women with Children Ages 6 to 17 years

In terms of unemployment among women with children ages 6 to 17 years, the demographic groups most similar to Czechs are Immigrants from Northern Africa (8.7%, a difference of 0.010%), Hmong (8.7%, a difference of 0.020%), South African (8.7%, a difference of 0.030%), Immigrants from Morocco (8.7%, a difference of 0.10%), and Immigrants from Lebanon (8.7%, a difference of 0.10%).
DemographicsRating | RankUnemployment Among Women with Children Ages 6 to 17 years
Israelis
95.9
/100
|
#120
Exceptional
8.7%
Immigrants from Denmark
95.5
/100
|
#121
Exceptional
8.7%
Immigrants from Egypt
95.0
/100
|
#122
Exceptional
8.7%
Immigrants from Morocco
94.9
/100
|
#123
Exceptional
8.7%
Immigrants from Lebanon
94.9
/100
|
#124
Exceptional
8.7%
South Africans
94.6
/100
|
#125
Exceptional
8.7%
Immigrants from Northern Africa
94.4
/100
|
#126
Exceptional
8.7%
Czechs
94.4
/100
|
#127
Exceptional
8.7%
Hmong
94.3
/100
|
#128
Exceptional
8.7%
Barbadians
93.8
/100
|
#129
Exceptional
8.7%
Immigrants from Western Asia
93.1
/100
|
#130
Exceptional
8.7%
Slavs
92.2
/100
|
#131
Exceptional
8.7%
Yaqui
92.2
/100
|
#132
Exceptional
8.7%
Egyptians
91.8
/100
|
#133
Exceptional
8.7%
Immigrants from Ireland
91.0
/100
|
#134
Exceptional
8.7%

Czech Unemployment Among Women with Children Ages 6 to 17 years Correlation Summary

MeasurementCzech DataUnemployment Among Women with Children Ages 6 to 17 years Data
Minimum0.14%4.6%
Maximum45.3%100.0%
Range45.1%95.4%
Mean10.3%22.1%
Median7.1%10.4%
Interquartile 25% (IQ1)3.6%8.3%
Interquartile 75% (IQ3)13.9%21.6%
Interquartile Range (IQR)10.3%13.3%
Standard Deviation (Sample)10.3%27.9%
Standard Deviation (Population)10.2%27.6%

Correlation Details

Czech PercentileSample SizeUnemployment Among Women with Children Ages 6 to 17 years
[
0.0%
-
0.5%
]
0.14%
201,762,8109.3%
[
0.0%
-
0.5%
]
0.43%
75,263,6408.6%
[
0.5%
-
1.0%
]
0.75%
20,130,7478.3%
[
1.0%
-
1.5%
]
1.07%
9,316,0947.7%
[
1.0%
-
1.5%
]
1.37%
4,814,2068.7%
[
1.5%
-
2.0%
]
1.70%
2,634,2839.3%
[
1.5%
-
2.0%
]
2.00%
1,553,79410.5%
[
2.0%
-
2.5%
]
2.30%
880,6469.8%
[
2.5%
-
3.0%
]
2.64%
496,4236.9%
[
2.5%
-
3.0%
]
2.91%
471,6635.9%
[
3.0%
-
3.5%
]
3.24%
744,5364.7%
[
3.5%
-
4.0%
]
3.57%
118,1515.7%
[
3.5%
-
4.0%
]
3.96%
63,91210.5%
[
4.0%
-
4.5%
]
4.10%
366,3355.1%
[
4.0%
-
4.5%
]
4.48%
368,3507.5%
[
4.5%
-
5.0%
]
4.76%
155,4988.5%
[
5.0%
-
5.5%
]
5.05%
124,6669.3%
[
5.0%
-
5.5%
]
5.33%
135,65311.0%
[
5.5%
-
6.0%
]
5.71%
5,67512.9%
[
6.0%
-
6.5%
]
6.17%
81100.0%
[
6.0%
-
6.5%
]
6.27%
14,85921.6%
[
6.5%
-
7.0%
]
6.62%
43,2014.6%
[
6.5%
-
7.0%
]
6.86%
16,5007.2%
[
7.0%
-
7.5%
]
7.28%
7,35212.2%
[
7.0%
-
7.5%
]
7.49%
2,56319.3%
[
7.5%
-
8.0%
]
7.84%
13,45623.1%
[
8.0%
-
8.5%
]
8.50%
95356.1%
[
8.5%
-
9.0%
]
8.90%
3,76584.9%
[
9.5%
-
10.0%
]
9.89%
9,82417.7%
[
10.0%
-
10.5%
]
10.47%
2,01618.4%
[
11.0%
-
11.5%
]
11.04%
6,1069.3%
[
11.0%
-
11.5%
]
11.30%
66414.3%
[
12.0%
-
12.5%
]
12.11%
735100.0%
[
12.5%
-
13.0%
]
12.74%
4,8499.5%
[
13.5%
-
14.0%
]
13.89%
8715.6%
[
13.5%
-
14.0%
]
13.97%
21,40710.3%
[
14.5%
-
15.0%
]
14.51%
2,8258.3%
[
15.0%
-
15.5%
]
15.05%
2,9838.6%
[
17.0%
-
17.5%
]
17.05%
305100.0%
[
18.5%
-
19.0%
]
18.62%
1,04721.9%
[
19.0%
-
19.5%
]
19.47%
1,29421.9%
[
21.0%
-
21.5%
]
21.15%
4,83226.0%
[
22.0%
-
22.5%
]
22.27%
5,65321.9%
[
37.0%
-
37.5%
]
37.45%
275100.0%
[
43.5%
-
44.0%
]
43.86%
34220.0%
[
45.0%
-
45.5%
]
45.29%
61613.3%