Czech Receiving Food Stamps
COMPARE
Czech
Select to Compare
Receiving Food Stamps
Czech Receiving Food Stamps
9.2%
PUBLIC INCOME | FOOD STAMPS
99.8/ 100
METRIC RATING
28th/ 347
METRIC RANK
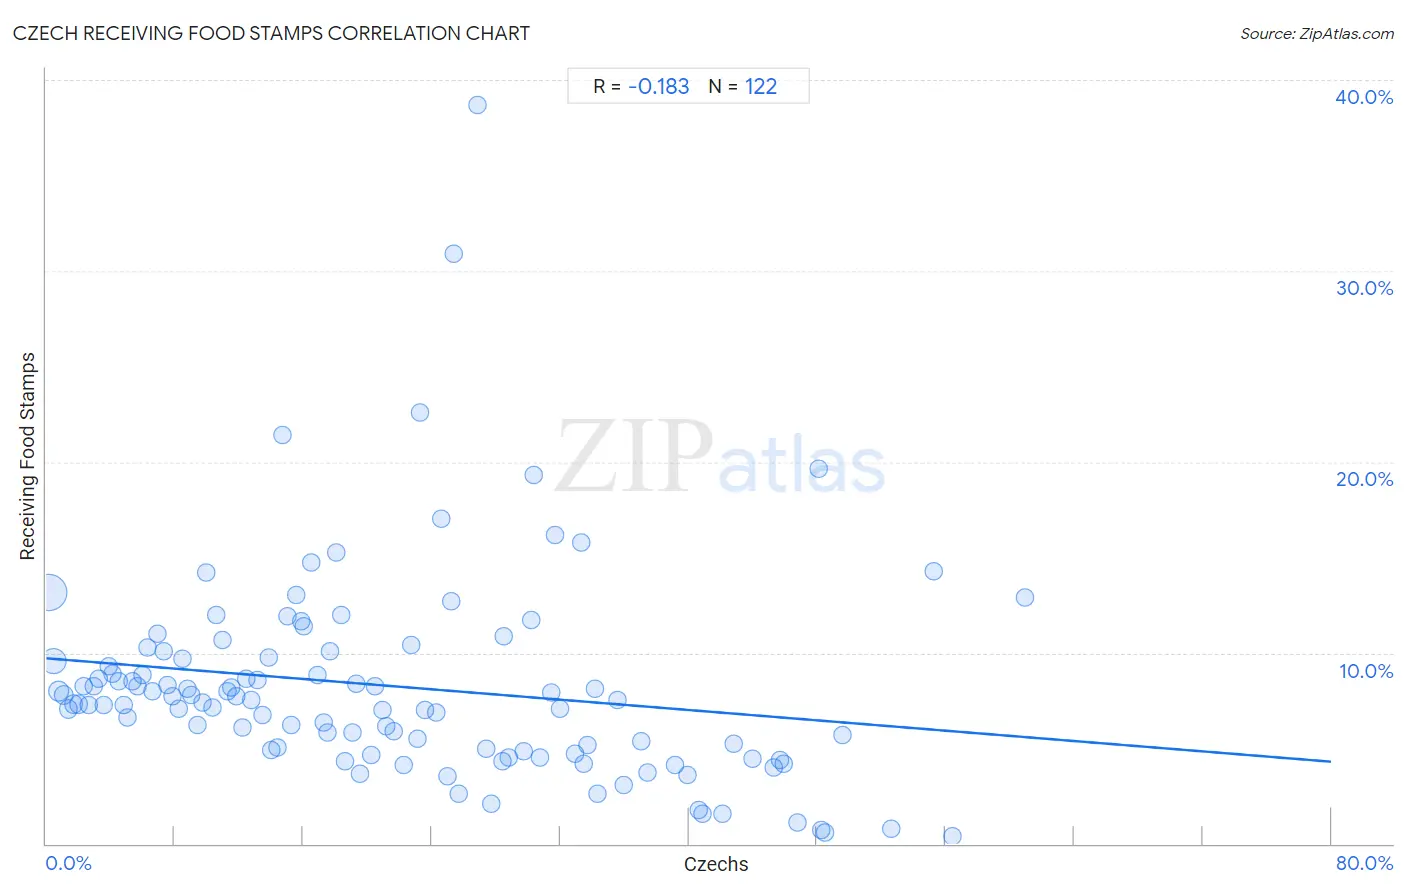
Czech Receiving Food Stamps Correlation Chart
The statistical analysis conducted on geographies consisting of 482,652,589 people shows a poor negative correlation between the proportion of Czechs and percentage of population receiving government assistance and/or food stamps in the United States with a correlation coefficient (R) of -0.183 and weighted average of 9.2%. On average, for every 1% (one percent) increase in Czechs within a typical geography, there is a decrease of 0.068% in percentage of population receiving government assistance and/or food stamps.
It is essential to understand that the correlation between the percentage of Czechs and percentage of population receiving government assistance and/or food stamps does not imply a direct cause-and-effect relationship. It remains uncertain whether the presence of Czechs influences an upward or downward trend in the level of percentage of population receiving government assistance and/or food stamps within an area, or if Czechs simply ended up residing in those areas with higher or lower levels of percentage of population receiving government assistance and/or food stamps due to other factors.
Demographics Similar to Czechs by Receiving Food Stamps
In terms of receiving food stamps, the demographic groups most similar to Czechs are Bhutanese (9.2%, a difference of 0.010%), Swedish (9.2%, a difference of 0.25%), Immigrants from Lithuania (9.2%, a difference of 0.27%), Immigrants from Ireland (9.2%, a difference of 0.45%), and Immigrants from Northern Europe (9.2%, a difference of 0.55%).
| Demographics | Rating | Rank | Receiving Food Stamps |
| Luxembourgers | 99.8 /100 | #21 | Exceptional 9.1% |
| Immigrants from Australia | 99.8 /100 | #22 | Exceptional 9.2% |
| Eastern Europeans | 99.8 /100 | #23 | Exceptional 9.2% |
| Immigrants from Northern Europe | 99.8 /100 | #24 | Exceptional 9.2% |
| Immigrants from Ireland | 99.8 /100 | #25 | Exceptional 9.2% |
| Swedes | 99.8 /100 | #26 | Exceptional 9.2% |
| Bhutanese | 99.8 /100 | #27 | Exceptional 9.2% |
| Czechs | 99.8 /100 | #28 | Exceptional 9.2% |
| Immigrants from Lithuania | 99.8 /100 | #29 | Exceptional 9.2% |
| Immigrants from Sweden | 99.7 /100 | #30 | Exceptional 9.3% |
| Immigrants from Eastern Asia | 99.7 /100 | #31 | Exceptional 9.3% |
| Bolivians | 99.7 /100 | #32 | Exceptional 9.3% |
| Zimbabweans | 99.6 /100 | #33 | Exceptional 9.5% |
| Turks | 99.6 /100 | #34 | Exceptional 9.5% |
| Immigrants from Austria | 99.6 /100 | #35 | Exceptional 9.5% |
Czech Receiving Food Stamps Correlation Summary
| Measurement | Czech Data | Receiving Food Stamps Data |
| Minimum | 0.15% | 0.40% |
| Maximum | 60.9% | 38.7% |
| Range | 60.7% | 38.3% |
| Mean | 21.5% | 8.3% |
| Median | 18.9% | 7.5% |
| Interquartile 25% (IQ1) | 9.4% | 4.9% |
| Interquartile 75% (IQ3) | 31.6% | 9.7% |
| Interquartile Range (IQR) | 22.3% | 4.8% |
| Standard Deviation (Sample) | 14.8% | 5.5% |
| Standard Deviation (Population) | 14.7% | 5.4% |
Correlation Details
| Czech Percentile | Sample Size | Receiving Food Stamps |
[ 0.0% - 0.5% ] 0.15% | 277,303,328 | 13.2% |
[ 0.0% - 0.5% ] 0.43% | 115,485,445 | 9.6% |
[ 0.5% - 1.0% ] 0.75% | 39,109,851 | 8.0% |
[ 1.0% - 1.5% ] 1.06% | 18,999,416 | 7.8% |
[ 1.0% - 1.5% ] 1.38% | 10,589,133 | 7.1% |
[ 1.5% - 2.0% ] 1.69% | 6,417,352 | 7.3% |
[ 2.0% - 2.5% ] 2.01% | 3,994,749 | 7.3% |
[ 2.0% - 2.5% ] 2.30% | 2,156,845 | 8.3% |
[ 2.5% - 3.0% ] 2.61% | 1,633,450 | 7.3% |
[ 2.5% - 3.0% ] 2.92% | 1,139,343 | 8.2% |
[ 3.0% - 3.5% ] 3.23% | 1,293,434 | 8.6% |
[ 3.5% - 4.0% ] 3.55% | 591,626 | 7.3% |
[ 3.5% - 4.0% ] 3.89% | 413,706 | 9.3% |
[ 4.0% - 4.5% ] 4.14% | 607,700 | 8.9% |
[ 4.0% - 4.5% ] 4.49% | 621,589 | 8.5% |
[ 4.5% - 5.0% ] 4.79% | 451,239 | 7.3% |
[ 5.0% - 5.5% ] 5.06% | 311,107 | 6.6% |
[ 5.0% - 5.5% ] 5.36% | 268,838 | 8.5% |
[ 5.5% - 6.0% ] 5.65% | 85,429 | 8.3% |
[ 5.5% - 6.0% ] 6.00% | 93,677 | 8.8% |
[ 6.0% - 6.5% ] 6.29% | 73,703 | 10.3% |
[ 6.5% - 7.0% ] 6.62% | 126,194 | 8.0% |
[ 6.5% - 7.0% ] 6.96% | 66,197 | 11.0% |
[ 7.0% - 7.5% ] 7.32% | 75,499 | 10.1% |
[ 7.5% - 8.0% ] 7.55% | 75,966 | 8.3% |
[ 7.5% - 8.0% ] 7.85% | 68,574 | 7.7% |
[ 8.0% - 8.5% ] 8.23% | 63,408 | 7.1% |
[ 8.0% - 8.5% ] 8.47% | 47,449 | 9.7% |
[ 8.5% - 9.0% ] 8.81% | 31,483 | 8.1% |
[ 9.0% - 9.5% ] 9.06% | 14,705 | 7.8% |
[ 9.0% - 9.5% ] 9.39% | 12,541 | 6.2% |
[ 9.5% - 10.0% ] 9.70% | 22,361 | 7.4% |
[ 9.5% - 10.0% ] 9.97% | 20,461 | 14.2% |
[ 10.0% - 10.5% ] 10.35% | 26,215 | 7.1% |
[ 10.5% - 11.0% ] 10.61% | 11,508 | 12.0% |
[ 10.5% - 11.0% ] 10.97% | 34,891 | 10.6% |
[ 11.0% - 11.5% ] 11.26% | 31,236 | 8.0% |
[ 11.5% - 12.0% ] 11.54% | 9,944 | 8.2% |
[ 11.5% - 12.0% ] 11.87% | 6,750 | 7.7% |
[ 12.0% - 12.5% ] 12.19% | 13,384 | 6.1% |
[ 12.0% - 12.5% ] 12.43% | 11,000 | 8.6% |
[ 12.5% - 13.0% ] 12.77% | 9,523 | 7.5% |
[ 13.0% - 13.5% ] 13.13% | 4,737 | 8.6% |
[ 13.0% - 13.5% ] 13.50% | 12,886 | 6.8% |
[ 13.5% - 14.0% ] 13.86% | 2,049 | 9.7% |
[ 13.5% - 14.0% ] 13.99% | 26,507 | 4.9% |
[ 14.0% - 14.5% ] 14.42% | 9,985 | 5.1% |
[ 14.5% - 15.0% ] 14.73% | 5,771 | 21.4% |
[ 15.0% - 15.5% ] 15.05% | 12,567 | 11.9% |
[ 15.0% - 15.5% ] 15.26% | 3,991 | 6.2% |
[ 15.5% - 16.0% ] 15.60% | 19,825 | 13.0% |
[ 15.5% - 16.0% ] 15.86% | 3,965 | 11.6% |
[ 16.0% - 16.5% ] 16.06% | 965 | 11.4% |
[ 16.0% - 16.5% ] 16.50% | 1,491 | 14.7% |
[ 16.5% - 17.0% ] 16.88% | 4,491 | 8.8% |
[ 17.0% - 17.5% ] 17.27% | 5,624 | 6.3% |
[ 17.0% - 17.5% ] 17.50% | 3,063 | 5.8% |
[ 17.5% - 18.0% ] 17.70% | 5,977 | 10.1% |
[ 18.0% - 18.5% ] 18.04% | 7,688 | 15.3% |
[ 18.0% - 18.5% ] 18.33% | 6,613 | 11.9% |
[ 18.5% - 19.0% ] 18.62% | 1,391 | 4.3% |
[ 19.0% - 19.5% ] 19.09% | 330 | 5.8% |
[ 19.0% - 19.5% ] 19.30% | 2,150 | 8.3% |
[ 19.5% - 20.0% ] 19.56% | 1,953 | 3.7% |
[ 20.0% - 20.5% ] 20.23% | 2,027 | 4.6% |
[ 20.0% - 20.5% ] 20.49% | 7,120 | 8.2% |
[ 20.5% - 21.0% ] 20.91% | 2,004 | 7.0% |
[ 21.0% - 21.5% ] 21.16% | 7,901 | 6.2% |
[ 21.5% - 22.0% ] 21.66% | 2,105 | 5.9% |
[ 22.0% - 22.5% ] 22.28% | 7,132 | 4.1% |
[ 22.5% - 23.0% ] 22.71% | 317 | 10.4% |
[ 23.0% - 23.5% ] 23.10% | 1,026 | 5.5% |
[ 23.0% - 23.5% ] 23.29% | 73 | 22.6% |
[ 23.5% - 24.0% ] 23.55% | 8,642 | 7.0% |
[ 24.0% - 24.5% ] 24.29% | 708 | 6.9% |
[ 24.5% - 25.0% ] 24.62% | 1,653 | 17.0% |
[ 25.0% - 25.5% ] 25.00% | 332 | 3.5% |
[ 25.0% - 25.5% ] 25.22% | 3,930 | 12.7% |
[ 25.0% - 25.5% ] 25.37% | 134 | 30.9% |
[ 25.5% - 26.0% ] 25.71% | 494 | 2.6% |
[ 26.5% - 27.0% ] 26.89% | 212 | 38.7% |
[ 27.0% - 27.5% ] 27.41% | 321 | 5.0% |
[ 27.5% - 28.0% ] 27.72% | 2,244 | 2.1% |
[ 28.0% - 28.5% ] 28.39% | 560 | 4.3% |
[ 28.5% - 29.0% ] 28.51% | 7,766 | 10.9% |
[ 28.5% - 29.0% ] 28.80% | 184 | 4.5% |
[ 29.5% - 30.0% ] 29.76% | 1,929 | 4.8% |
[ 30.0% - 30.5% ] 30.19% | 4,942 | 11.7% |
[ 30.0% - 30.5% ] 30.38% | 609 | 19.3% |
[ 30.5% - 31.0% ] 30.72% | 1,605 | 4.5% |
[ 31.0% - 31.5% ] 31.45% | 477 | 7.9% |
[ 31.5% - 32.0% ] 31.65% | 79 | 16.2% |
[ 32.0% - 32.5% ] 32.00% | 75 | 7.1% |
[ 32.5% - 33.0% ] 32.94% | 513 | 4.7% |
[ 33.0% - 33.5% ] 33.33% | 81 | 15.8% |
[ 33.0% - 33.5% ] 33.48% | 1,643 | 4.2% |
[ 33.5% - 34.0% ] 33.71% | 5,443 | 5.2% |
[ 34.0% - 34.5% ] 34.17% | 120 | 8.1% |
[ 34.0% - 34.5% ] 34.31% | 204 | 2.6% |
[ 35.5% - 36.0% ] 35.60% | 663 | 7.5% |
[ 35.5% - 36.0% ] 35.97% | 620 | 3.0% |
[ 37.0% - 37.5% ] 37.03% | 1,345 | 5.3% |
[ 37.0% - 37.5% ] 37.45% | 275 | 3.7% |
[ 39.0% - 39.5% ] 39.14% | 350 | 4.1% |
[ 39.5% - 40.0% ] 39.95% | 2,095 | 3.6% |
[ 40.5% - 41.0% ] 40.59% | 2,237 | 1.8% |
[ 40.5% - 41.0% ] 40.87% | 115 | 1.6% |
[ 42.0% - 42.5% ] 42.07% | 290 | 1.6% |
[ 42.5% - 43.0% ] 42.82% | 425 | 5.2% |
[ 43.5% - 44.0% ] 43.97% | 630 | 4.5% |
[ 45.0% - 45.5% ] 45.29% | 616 | 4.0% |
[ 45.5% - 46.0% ] 45.67% | 635 | 4.4% |
[ 45.5% - 46.0% ] 45.90% | 366 | 4.2% |
[ 46.5% - 47.0% ] 46.81% | 376 | 1.1% |
[ 48.0% - 48.5% ] 48.06% | 697 | 19.7% |
[ 48.0% - 48.5% ] 48.25% | 342 | 0.70% |
[ 48.0% - 48.5% ] 48.49% | 365 | 0.60% |
[ 49.5% - 50.0% ] 49.54% | 109 | 5.7% |
[ 52.5% - 53.0% ] 52.57% | 253 | 0.80% |
[ 55.0% - 55.5% ] 55.28% | 123 | 14.3% |
[ 56.0% - 56.5% ] 56.39% | 454 | 0.40% |
[ 60.5% - 61.0% ] 60.90% | 335 | 12.9% |