Czech Married-couple Households
COMPARE
Czech
Select to Compare
Married-couple Households
Czech Married-couple Households
49.4%
MARRIED-COUPLE HOUSEHOLDS
99.9/ 100
METRIC RATING
24th/ 347
METRIC RANK
Czech Married-couple Households Correlation Chart
The statistical analysis conducted on geographies consisting of 484,447,060 people shows a poor positive correlation between the proportion of Czechs and percentage of married-couple family households in the United States with a correlation coefficient (R) of 0.149 and weighted average of 49.4%. On average, for every 1% (one percent) increase in Czechs within a typical geography, there is an increase of 0.087% in percentage of married-couple family households.
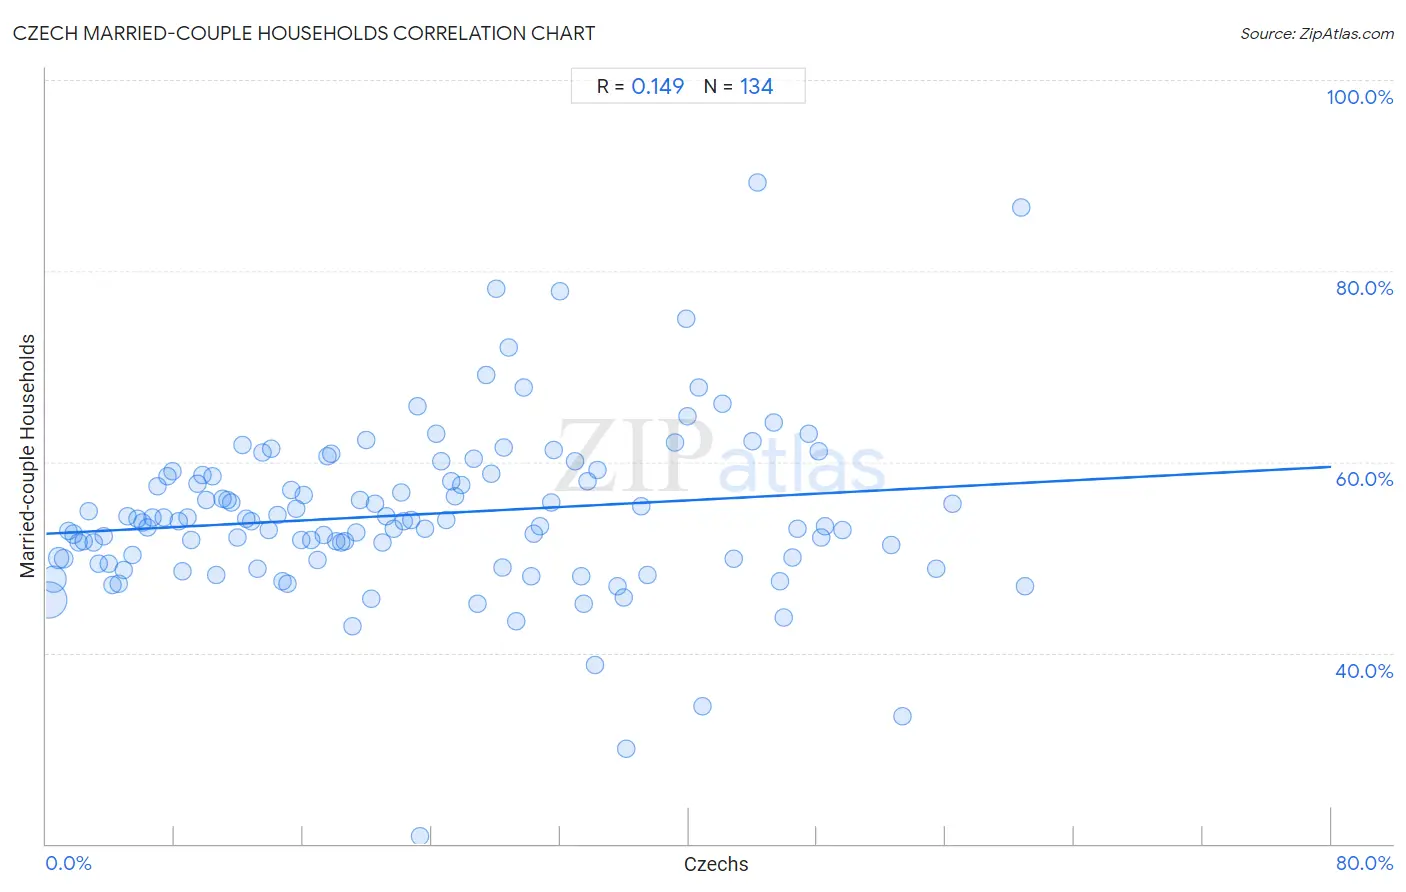
It is essential to understand that the correlation between the percentage of Czechs and percentage of married-couple family households does not imply a direct cause-and-effect relationship. It remains uncertain whether the presence of Czechs influences an upward or downward trend in the level of percentage of married-couple family households within an area, or if Czechs simply ended up residing in those areas with higher or lower levels of percentage of married-couple family households due to other factors.
Demographics Similar to Czechs by Married-couple Households
In terms of married-couple households, the demographic groups most similar to Czechs are Dutch (49.5%, a difference of 0.080%), Asian (49.5%, a difference of 0.090%), Immigrants from Philippines (49.3%, a difference of 0.19%), Norwegian (49.5%, a difference of 0.20%), and European (49.6%, a difference of 0.26%).
| Demographics | Rating | Rank | Married-couple Households |
| Immigrants from Hong Kong | 99.9 /100 | #17 | Exceptional 49.6% |
| English | 99.9 /100 | #18 | Exceptional 49.6% |
| Europeans | 99.9 /100 | #19 | Exceptional 49.6% |
| Scandinavians | 99.9 /100 | #20 | Exceptional 49.6% |
| Norwegians | 99.9 /100 | #21 | Exceptional 49.5% |
| Asians | 99.9 /100 | #22 | Exceptional 49.5% |
| Dutch | 99.9 /100 | #23 | Exceptional 49.5% |
| Czechs | 99.9 /100 | #24 | Exceptional 49.4% |
| Immigrants from Philippines | 99.9 /100 | #25 | Exceptional 49.3% |
| Immigrants from Scotland | 99.8 /100 | #26 | Exceptional 49.3% |
| Bhutanese | 99.8 /100 | #27 | Exceptional 49.3% |
| Germans | 99.8 /100 | #28 | Exceptional 49.2% |
| Maltese | 99.8 /100 | #29 | Exceptional 49.2% |
| Bolivians | 99.8 /100 | #30 | Exceptional 49.2% |
| Native Hawaiians | 99.8 /100 | #31 | Exceptional 49.1% |
Czech Married-couple Households Correlation Summary
| Measurement | Czech Data | Married-couple Households Data |
| Minimum | 0.15% | 20.8% |
| Maximum | 60.9% | 89.3% |
| Range | 60.7% | 68.5% |
| Mean | 23.0% | 54.5% |
| Median | 20.7% | 53.7% |
| Interquartile 25% (IQ1) | 10.4% | 49.8% |
| Interquartile 75% (IQ3) | 33.5% | 58.5% |
| Interquartile Range (IQR) | 23.1% | 8.6% |
| Standard Deviation (Sample) | 15.3% | 9.0% |
| Standard Deviation (Population) | 15.3% | 9.0% |
Correlation Details
| Czech Percentile | Sample Size | Married-couple Households |
[ 0.0% - 0.5% ] 0.15% | 277,757,528 | 45.5% |
[ 0.0% - 0.5% ] 0.43% | 115,953,609 | 47.7% |
[ 0.5% - 1.0% ] 0.75% | 39,352,204 | 49.9% |
[ 1.0% - 1.5% ] 1.06% | 19,134,575 | 49.9% |
[ 1.0% - 1.5% ] 1.38% | 10,708,142 | 52.8% |
[ 1.5% - 2.0% ] 1.69% | 6,491,120 | 52.4% |
[ 2.0% - 2.5% ] 2.00% | 4,090,403 | 51.6% |
[ 2.0% - 2.5% ] 2.30% | 2,187,619 | 51.7% |
[ 2.5% - 3.0% ] 2.61% | 1,652,912 | 54.8% |
[ 2.5% - 3.0% ] 2.93% | 1,161,693 | 51.5% |
[ 3.0% - 3.5% ] 3.23% | 1,302,755 | 49.3% |
[ 3.5% - 4.0% ] 3.55% | 605,336 | 52.3% |
[ 3.5% - 4.0% ] 3.88% | 432,124 | 49.3% |
[ 4.0% - 4.5% ] 4.14% | 616,541 | 47.1% |
[ 4.0% - 4.5% ] 4.49% | 628,472 | 47.3% |
[ 4.5% - 5.0% ] 4.79% | 459,899 | 48.6% |
[ 5.0% - 5.5% ] 5.06% | 314,152 | 54.3% |
[ 5.0% - 5.5% ] 5.36% | 274,282 | 50.3% |
[ 5.5% - 6.0% ] 5.65% | 88,856 | 54.0% |
[ 5.5% - 6.0% ] 6.00% | 99,397 | 53.7% |
[ 6.0% - 6.5% ] 6.30% | 77,111 | 53.2% |
[ 6.5% - 7.0% ] 6.62% | 130,377 | 54.2% |
[ 6.5% - 7.0% ] 6.96% | 68,832 | 57.4% |
[ 7.0% - 7.5% ] 7.31% | 77,993 | 54.1% |
[ 7.5% - 8.0% ] 7.55% | 78,524 | 58.5% |
[ 7.5% - 8.0% ] 7.85% | 71,162 | 59.0% |
[ 8.0% - 8.5% ] 8.23% | 65,486 | 53.7% |
[ 8.0% - 8.5% ] 8.47% | 48,658 | 48.6% |
[ 8.5% - 9.0% ] 8.81% | 32,062 | 54.2% |
[ 9.0% - 9.5% ] 9.06% | 14,760 | 51.8% |
[ 9.0% - 9.5% ] 9.41% | 14,846 | 57.7% |
[ 9.5% - 10.0% ] 9.70% | 24,377 | 58.6% |
[ 9.5% - 10.0% ] 9.98% | 21,970 | 56.0% |
[ 10.0% - 10.5% ] 10.35% | 28,249 | 58.4% |
[ 10.5% - 11.0% ] 10.61% | 12,693 | 48.1% |
[ 10.5% - 11.0% ] 10.97% | 35,527 | 56.1% |
[ 11.0% - 11.5% ] 11.26% | 32,150 | 56.0% |
[ 11.5% - 12.0% ] 11.55% | 10,620 | 55.8% |
[ 11.5% - 12.0% ] 11.87% | 7,077 | 52.1% |
[ 12.0% - 12.5% ] 12.20% | 16,224 | 61.7% |
[ 12.0% - 12.5% ] 12.44% | 11,901 | 54.1% |
[ 12.5% - 13.0% ] 12.77% | 9,744 | 53.8% |
[ 13.0% - 13.5% ] 13.12% | 5,837 | 48.8% |
[ 13.0% - 13.5% ] 13.49% | 13,530 | 61.0% |
[ 13.5% - 14.0% ] 13.86% | 2,251 | 52.9% |
[ 13.5% - 14.0% ] 13.99% | 26,728 | 61.4% |
[ 14.0% - 14.5% ] 14.41% | 10,427 | 54.4% |
[ 14.5% - 15.0% ] 14.72% | 6,332 | 47.5% |
[ 15.0% - 15.5% ] 15.05% | 12,715 | 47.2% |
[ 15.0% - 15.5% ] 15.26% | 3,991 | 57.1% |
[ 15.5% - 16.0% ] 15.60% | 20,101 | 55.1% |
[ 15.5% - 16.0% ] 15.86% | 4,060 | 51.8% |
[ 16.0% - 16.5% ] 16.06% | 965 | 56.5% |
[ 16.0% - 16.5% ] 16.50% | 1,600 | 51.8% |
[ 16.5% - 17.0% ] 16.87% | 5,051 | 49.7% |
[ 17.0% - 17.5% ] 17.26% | 5,688 | 52.3% |
[ 17.5% - 18.0% ] 17.50% | 3,285 | 60.6% |
[ 17.5% - 18.0% ] 17.72% | 7,265 | 60.9% |
[ 18.0% - 18.5% ] 18.04% | 7,688 | 51.6% |
[ 18.0% - 18.5% ] 18.33% | 6,613 | 51.5% |
[ 18.5% - 19.0% ] 18.62% | 1,391 | 51.7% |
[ 19.0% - 19.5% ] 19.07% | 367 | 42.8% |
[ 19.0% - 19.5% ] 19.30% | 2,243 | 52.6% |
[ 19.5% - 20.0% ] 19.56% | 2,086 | 56.0% |
[ 19.5% - 20.0% ] 19.94% | 356 | 62.3% |
[ 20.0% - 20.5% ] 20.23% | 2,027 | 45.6% |
[ 20.0% - 20.5% ] 20.49% | 7,247 | 55.6% |
[ 20.5% - 21.0% ] 20.91% | 2,004 | 51.6% |
[ 21.0% - 21.5% ] 21.16% | 7,901 | 54.3% |
[ 21.5% - 22.0% ] 21.66% | 2,105 | 53.0% |
[ 22.0% - 22.5% ] 22.08% | 874 | 56.8% |
[ 22.0% - 22.5% ] 22.28% | 7,132 | 53.7% |
[ 22.5% - 23.0% ] 22.72% | 471 | 53.9% |
[ 23.0% - 23.5% ] 23.08% | 1,352 | 65.8% |
[ 23.0% - 23.5% ] 23.29% | 73 | 20.8% |
[ 23.5% - 24.0% ] 23.55% | 9,075 | 53.0% |
[ 24.0% - 24.5% ] 24.26% | 878 | 63.0% |
[ 24.5% - 25.0% ] 24.62% | 1,653 | 60.1% |
[ 24.5% - 25.0% ] 24.91% | 562 | 53.9% |
[ 25.0% - 25.5% ] 25.22% | 3,930 | 58.0% |
[ 25.0% - 25.5% ] 25.41% | 181 | 56.5% |
[ 25.5% - 26.0% ] 25.83% | 1,738 | 57.6% |
[ 26.5% - 27.0% ] 26.59% | 425 | 60.3% |
[ 26.5% - 27.0% ] 26.89% | 212 | 45.2% |
[ 27.0% - 27.5% ] 27.41% | 343 | 69.1% |
[ 27.5% - 28.0% ] 27.72% | 2,244 | 58.7% |
[ 28.0% - 28.5% ] 28.05% | 82 | 78.1% |
[ 28.0% - 28.5% ] 28.39% | 560 | 48.9% |
[ 28.5% - 29.0% ] 28.51% | 7,766 | 61.5% |
[ 28.5% - 29.0% ] 28.81% | 236 | 72.0% |
[ 29.0% - 29.5% ] 29.29% | 99 | 43.4% |
[ 29.5% - 30.0% ] 29.76% | 1,929 | 67.8% |
[ 30.0% - 30.5% ] 30.19% | 5,088 | 48.0% |
[ 30.0% - 30.5% ] 30.38% | 609 | 52.5% |
[ 30.5% - 31.0% ] 30.72% | 1,618 | 53.3% |
[ 31.0% - 31.5% ] 31.44% | 776 | 55.7% |
[ 31.5% - 32.0% ] 31.58% | 361 | 61.3% |
[ 31.5% - 32.0% ] 31.95% | 169 | 77.8% |
[ 32.5% - 33.0% ] 32.94% | 513 | 60.1% |
[ 33.0% - 33.5% ] 33.33% | 183 | 48.0% |
[ 33.0% - 33.5% ] 33.48% | 1,643 | 45.1% |
[ 33.5% - 34.0% ] 33.71% | 5,443 | 58.0% |
[ 34.0% - 34.5% ] 34.17% | 120 | 38.7% |
[ 34.0% - 34.5% ] 34.31% | 204 | 59.2% |
[ 35.5% - 36.0% ] 35.60% | 663 | 47.0% |
[ 35.5% - 36.0% ] 35.97% | 620 | 45.8% |
[ 36.0% - 36.5% ] 36.14% | 166 | 29.9% |
[ 37.0% - 37.5% ] 37.03% | 1,345 | 55.4% |
[ 37.0% - 37.5% ] 37.45% | 275 | 48.1% |
[ 39.0% - 39.5% ] 39.14% | 350 | 62.1% |
[ 39.5% - 40.0% ] 39.83% | 118 | 75.0% |
[ 39.5% - 40.0% ] 39.95% | 2,095 | 64.8% |
[ 40.5% - 41.0% ] 40.59% | 2,237 | 67.8% |
[ 40.5% - 41.0% ] 40.87% | 115 | 34.4% |
[ 42.0% - 42.5% ] 42.07% | 290 | 66.1% |
[ 42.5% - 43.0% ] 42.83% | 635 | 49.8% |
[ 43.5% - 44.0% ] 43.97% | 630 | 62.1% |
[ 44.0% - 44.5% ] 44.30% | 79 | 89.3% |
[ 45.0% - 45.5% ] 45.29% | 616 | 64.2% |
[ 45.5% - 46.0% ] 45.66% | 679 | 47.5% |
[ 45.5% - 46.0% ] 45.90% | 427 | 43.7% |
[ 46.0% - 46.5% ] 46.43% | 28 | 50.0% |
[ 46.5% - 47.0% ] 46.81% | 376 | 52.9% |
[ 47.0% - 47.5% ] 47.46% | 118 | 63.0% |
[ 48.0% - 48.5% ] 48.08% | 626 | 61.1% |
[ 48.0% - 48.5% ] 48.25% | 342 | 52.1% |
[ 48.0% - 48.5% ] 48.49% | 365 | 53.2% |
[ 49.5% - 50.0% ] 49.54% | 109 | 52.8% |
[ 52.5% - 53.0% ] 52.57% | 272 | 51.3% |
[ 53.0% - 53.5% ] 53.33% | 30 | 33.3% |
[ 55.0% - 55.5% ] 55.38% | 251 | 48.8% |
[ 56.0% - 56.5% ] 56.39% | 454 | 55.7% |
[ 60.5% - 61.0% ] 60.71% | 56 | 86.7% |
[ 60.5% - 61.0% ] 60.90% | 335 | 47.0% |