Czech Female Disability
COMPARE
Czech
Select to Compare
Female Disability
Czech Female Disability
12.1%
DISABILITY | FEMALES
63.6/ 100
METRIC RATING
164th/ 347
METRIC RANK
Czech Female Disability Correlation Chart
The statistical analysis conducted on geographies consisting of 484,697,758 people shows a slight positive correlation between the proportion of Czechs and percentage of females with a disability in the United States with a correlation coefficient (R) of 0.075 and weighted average of 12.1%. On average, for every 1% (one percent) increase in Czechs within a typical geography, there is an increase of 0.031% in percentage of females with a disability.
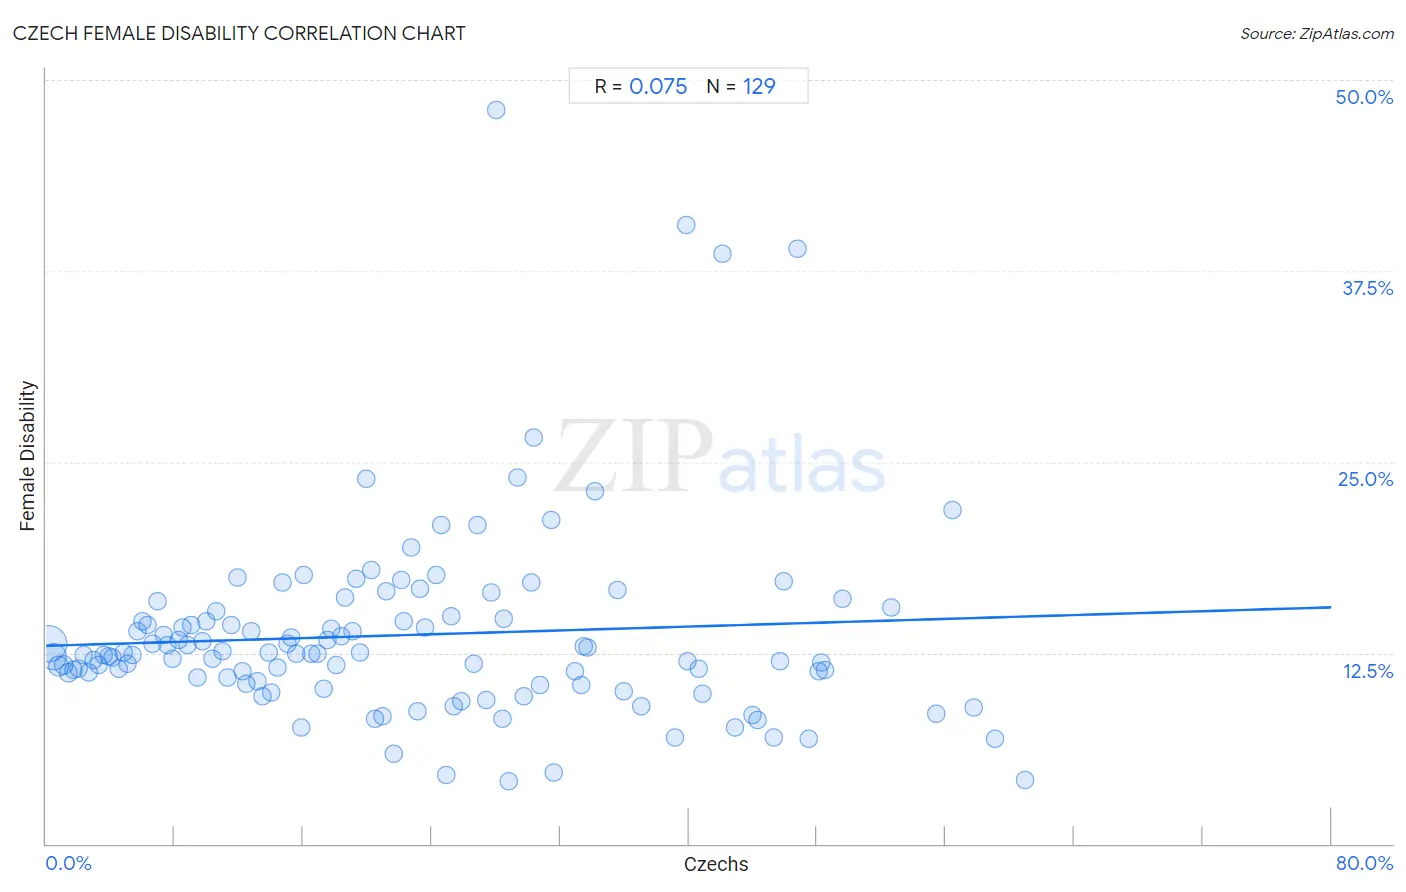
It is essential to understand that the correlation between the percentage of Czechs and percentage of females with a disability does not imply a direct cause-and-effect relationship. It remains uncertain whether the presence of Czechs influences an upward or downward trend in the level of percentage of females with a disability within an area, or if Czechs simply ended up residing in those areas with higher or lower levels of percentage of females with a disability due to other factors.
Demographics Similar to Czechs by Female Disability
In terms of female disability, the demographic groups most similar to Czechs are Guatemalan (12.1%, a difference of 0.010%), Immigrants from Ukraine (12.1%, a difference of 0.030%), Guyanese (12.1%, a difference of 0.040%), Immigrants from Oceania (12.1%, a difference of 0.070%), and Immigrants from Guatemala (12.1%, a difference of 0.10%).
| Demographics | Rating | Rank | Female Disability |
| Danes | 72.5 /100 | #157 | Good 12.1% |
| Immigrants from Middle Africa | 72.4 /100 | #158 | Good 12.1% |
| Immigrants from Central America | 67.7 /100 | #159 | Good 12.1% |
| Immigrants from Guatemala | 66.0 /100 | #160 | Good 12.1% |
| Guyanese | 64.7 /100 | #161 | Good 12.1% |
| Immigrants from Ukraine | 64.3 /100 | #162 | Good 12.1% |
| Guatemalans | 63.8 /100 | #163 | Good 12.1% |
| Czechs | 63.6 /100 | #164 | Good 12.1% |
| Immigrants from Oceania | 61.8 /100 | #165 | Good 12.1% |
| Lithuanians | 59.5 /100 | #166 | Average 12.2% |
| Immigrants from Latin America | 59.0 /100 | #167 | Average 12.2% |
| Immigrants from Haiti | 58.8 /100 | #168 | Average 12.2% |
| Lebanese | 58.1 /100 | #169 | Average 12.2% |
| Maltese | 57.0 /100 | #170 | Average 12.2% |
| Immigrants from Southern Europe | 56.3 /100 | #171 | Average 12.2% |
Czech Female Disability Correlation Summary
| Measurement | Czech Data | Female Disability Data |
| Minimum | 0.15% | 4.1% |
| Maximum | 60.9% | 48.0% |
| Range | 60.7% | 43.9% |
| Mean | 22.5% | 13.7% |
| Median | 19.9% | 12.5% |
| Interquartile 25% (IQ1) | 9.8% | 10.6% |
| Interquartile 75% (IQ3) | 32.3% | 14.8% |
| Interquartile Range (IQR) | 22.4% | 4.3% |
| Standard Deviation (Sample) | 15.4% | 6.4% |
| Standard Deviation (Population) | 15.3% | 6.4% |
Correlation Details
| Czech Percentile | Sample Size | Female Disability |
[ 0.0% - 0.5% ] 0.15% | 277,924,635 | 13.1% |
[ 0.0% - 0.5% ] 0.43% | 115,995,806 | 12.2% |
[ 0.5% - 1.0% ] 0.75% | 39,380,225 | 11.6% |
[ 1.0% - 1.5% ] 1.06% | 19,158,514 | 11.7% |
[ 1.0% - 1.5% ] 1.38% | 10,710,227 | 11.2% |
[ 1.5% - 2.0% ] 1.69% | 6,496,543 | 11.4% |
[ 2.0% - 2.5% ] 2.00% | 4,099,725 | 11.5% |
[ 2.0% - 2.5% ] 2.30% | 2,187,799 | 12.4% |
[ 2.5% - 3.0% ] 2.61% | 1,653,566 | 11.2% |
[ 2.5% - 3.0% ] 2.93% | 1,158,840 | 12.0% |
[ 3.0% - 3.5% ] 3.23% | 1,302,361 | 11.7% |
[ 3.5% - 4.0% ] 3.55% | 600,695 | 12.3% |
[ 3.5% - 4.0% ] 3.88% | 431,730 | 12.2% |
[ 4.0% - 4.5% ] 4.14% | 615,947 | 12.2% |
[ 4.0% - 4.5% ] 4.49% | 628,247 | 11.4% |
[ 4.5% - 5.0% ] 4.79% | 460,612 | 12.5% |
[ 5.0% - 5.5% ] 5.06% | 312,967 | 11.8% |
[ 5.0% - 5.5% ] 5.36% | 273,023 | 12.4% |
[ 5.5% - 6.0% ] 5.65% | 87,003 | 13.9% |
[ 5.5% - 6.0% ] 6.00% | 97,792 | 14.5% |
[ 6.0% - 6.5% ] 6.30% | 76,776 | 14.3% |
[ 6.5% - 7.0% ] 6.62% | 130,362 | 13.1% |
[ 6.5% - 7.0% ] 6.96% | 68,504 | 15.8% |
[ 7.0% - 7.5% ] 7.31% | 77,651 | 13.6% |
[ 7.5% - 8.0% ] 7.55% | 75,473 | 13.0% |
[ 7.5% - 8.0% ] 7.84% | 69,575 | 12.1% |
[ 8.0% - 8.5% ] 8.23% | 64,314 | 13.3% |
[ 8.0% - 8.5% ] 8.47% | 48,658 | 14.2% |
[ 8.5% - 9.0% ] 8.81% | 31,904 | 13.0% |
[ 9.0% - 9.5% ] 9.06% | 14,705 | 14.3% |
[ 9.0% - 9.5% ] 9.41% | 14,593 | 10.9% |
[ 9.5% - 10.0% ] 9.70% | 24,077 | 13.2% |
[ 9.5% - 10.0% ] 9.98% | 21,940 | 14.6% |
[ 10.0% - 10.5% ] 10.35% | 28,249 | 12.1% |
[ 10.5% - 11.0% ] 10.61% | 12,403 | 15.2% |
[ 10.5% - 11.0% ] 10.97% | 35,400 | 12.6% |
[ 11.0% - 11.5% ] 11.26% | 31,830 | 10.9% |
[ 11.5% - 12.0% ] 11.55% | 10,620 | 14.4% |
[ 11.5% - 12.0% ] 11.87% | 6,934 | 17.4% |
[ 12.0% - 12.5% ] 12.20% | 15,187 | 11.3% |
[ 12.0% - 12.5% ] 12.43% | 11,766 | 10.5% |
[ 12.5% - 13.0% ] 12.77% | 9,407 | 13.9% |
[ 13.0% - 13.5% ] 13.12% | 5,715 | 10.6% |
[ 13.0% - 13.5% ] 13.49% | 13,530 | 9.6% |
[ 13.5% - 14.0% ] 13.86% | 2,049 | 12.5% |
[ 13.5% - 14.0% ] 13.99% | 26,728 | 9.9% |
[ 14.0% - 14.5% ] 14.42% | 10,364 | 11.5% |
[ 14.5% - 15.0% ] 14.72% | 6,332 | 17.1% |
[ 15.0% - 15.5% ] 15.05% | 12,715 | 13.1% |
[ 15.0% - 15.5% ] 15.26% | 3,782 | 13.5% |
[ 15.5% - 16.0% ] 15.60% | 20,101 | 12.5% |
[ 15.5% - 16.0% ] 15.85% | 3,338 | 7.6% |
[ 16.0% - 16.5% ] 16.06% | 965 | 17.6% |
[ 16.0% - 16.5% ] 16.50% | 1,600 | 12.5% |
[ 16.5% - 17.0% ] 16.88% | 4,645 | 12.5% |
[ 17.0% - 17.5% ] 17.26% | 5,688 | 10.2% |
[ 17.0% - 17.5% ] 17.50% | 3,103 | 13.4% |
[ 17.5% - 18.0% ] 17.71% | 7,220 | 14.1% |
[ 18.0% - 18.5% ] 18.04% | 7,688 | 11.7% |
[ 18.0% - 18.5% ] 18.33% | 6,613 | 13.6% |
[ 18.5% - 19.0% ] 18.62% | 1,391 | 16.2% |
[ 19.0% - 19.5% ] 19.07% | 367 | 13.9% |
[ 19.0% - 19.5% ] 19.30% | 2,243 | 17.3% |
[ 19.5% - 20.0% ] 19.56% | 2,086 | 12.5% |
[ 19.5% - 20.0% ] 19.94% | 321 | 23.9% |
[ 20.0% - 20.5% ] 20.23% | 2,027 | 17.9% |
[ 20.0% - 20.5% ] 20.49% | 7,066 | 8.2% |
[ 20.5% - 21.0% ] 20.91% | 1,889 | 8.4% |
[ 21.0% - 21.5% ] 21.16% | 7,901 | 16.5% |
[ 21.5% - 22.0% ] 21.66% | 2,105 | 5.9% |
[ 22.0% - 22.5% ] 22.08% | 874 | 17.2% |
[ 22.0% - 22.5% ] 22.28% | 7,132 | 14.6% |
[ 22.5% - 23.0% ] 22.71% | 317 | 19.4% |
[ 23.0% - 23.5% ] 23.08% | 1,161 | 8.7% |
[ 23.0% - 23.5% ] 23.29% | 73 | 16.7% |
[ 23.5% - 24.0% ] 23.55% | 9,075 | 14.2% |
[ 24.0% - 24.5% ] 24.26% | 878 | 17.6% |
[ 24.5% - 25.0% ] 24.62% | 1,653 | 20.9% |
[ 24.5% - 25.0% ] 24.90% | 510 | 4.5% |
[ 25.0% - 25.5% ] 25.22% | 4,037 | 14.9% |
[ 25.0% - 25.5% ] 25.37% | 134 | 9.0% |
[ 25.5% - 26.0% ] 25.85% | 1,532 | 9.3% |
[ 26.5% - 27.0% ] 26.59% | 425 | 11.8% |
[ 26.5% - 27.0% ] 26.89% | 212 | 20.9% |
[ 27.0% - 27.5% ] 27.41% | 321 | 9.4% |
[ 27.5% - 28.0% ] 27.72% | 2,244 | 16.5% |
[ 28.0% - 28.5% ] 28.05% | 82 | 48.0% |
[ 28.0% - 28.5% ] 28.40% | 514 | 8.2% |
[ 28.5% - 29.0% ] 28.51% | 7,766 | 14.7% |
[ 28.5% - 29.0% ] 28.81% | 236 | 4.1% |
[ 29.0% - 29.5% ] 29.33% | 75 | 24.0% |
[ 29.5% - 30.0% ] 29.76% | 1,929 | 9.6% |
[ 30.0% - 30.5% ] 30.19% | 5,088 | 17.1% |
[ 30.0% - 30.5% ] 30.38% | 609 | 26.6% |
[ 30.5% - 31.0% ] 30.72% | 1,618 | 10.4% |
[ 31.0% - 31.5% ] 31.44% | 776 | 21.2% |
[ 31.5% - 32.0% ] 31.58% | 361 | 4.6% |
[ 32.5% - 33.0% ] 32.94% | 513 | 11.3% |
[ 33.0% - 33.5% ] 33.33% | 183 | 10.4% |
[ 33.0% - 33.5% ] 33.48% | 1,643 | 12.9% |
[ 33.5% - 34.0% ] 33.71% | 5,443 | 12.9% |
[ 34.0% - 34.5% ] 34.17% | 120 | 23.1% |
[ 35.5% - 36.0% ] 35.60% | 663 | 16.6% |
[ 35.5% - 36.0% ] 35.97% | 620 | 10.0% |
[ 37.0% - 37.5% ] 37.03% | 1,345 | 9.0% |
[ 39.0% - 39.5% ] 39.14% | 350 | 6.9% |
[ 39.5% - 40.0% ] 39.83% | 118 | 40.5% |
[ 39.5% - 40.0% ] 39.95% | 2,095 | 12.0% |
[ 40.5% - 41.0% ] 40.59% | 2,237 | 11.5% |
[ 40.5% - 41.0% ] 40.87% | 115 | 9.8% |
[ 42.0% - 42.5% ] 42.07% | 290 | 38.7% |
[ 42.5% - 43.0% ] 42.86% | 420 | 7.6% |
[ 43.5% - 44.0% ] 43.97% | 630 | 8.4% |
[ 44.0% - 44.5% ] 44.30% | 79 | 8.1% |
[ 45.0% - 45.5% ] 45.29% | 616 | 7.0% |
[ 45.5% - 46.0% ] 45.66% | 679 | 11.9% |
[ 45.5% - 46.0% ] 45.90% | 427 | 17.2% |
[ 46.5% - 47.0% ] 46.81% | 376 | 38.9% |
[ 47.0% - 47.5% ] 47.46% | 118 | 6.9% |
[ 48.0% - 48.5% ] 48.09% | 601 | 11.3% |
[ 48.0% - 48.5% ] 48.25% | 342 | 11.9% |
[ 48.0% - 48.5% ] 48.49% | 365 | 11.4% |
[ 49.5% - 50.0% ] 49.54% | 109 | 16.0% |
[ 52.5% - 53.0% ] 52.57% | 253 | 15.5% |
[ 55.0% - 55.5% ] 55.38% | 251 | 8.5% |
[ 56.0% - 56.5% ] 56.39% | 454 | 21.8% |
[ 57.5% - 58.0% ] 57.78% | 135 | 9.0% |
[ 59.0% - 59.5% ] 59.09% | 44 | 6.9% |
[ 60.5% - 61.0% ] 60.90% | 335 | 4.2% |