Czech Disability
COMPARE
Czech
Select to Compare
Disability
Czech Disability
12.0%
DISABILITY
7.9/ 100
METRIC RATING
210th/ 347
METRIC RANK
Czech Disability Correlation Chart
The statistical analysis conducted on geographies consisting of 484,761,061 people shows a poor positive correlation between the proportion of Czechs and percentage of population with a disability in the United States with a correlation coefficient (R) of 0.137 and weighted average of 12.0%. On average, for every 1% (one percent) increase in Czechs within a typical geography, there is an increase of 0.046% in percentage of population with a disability.
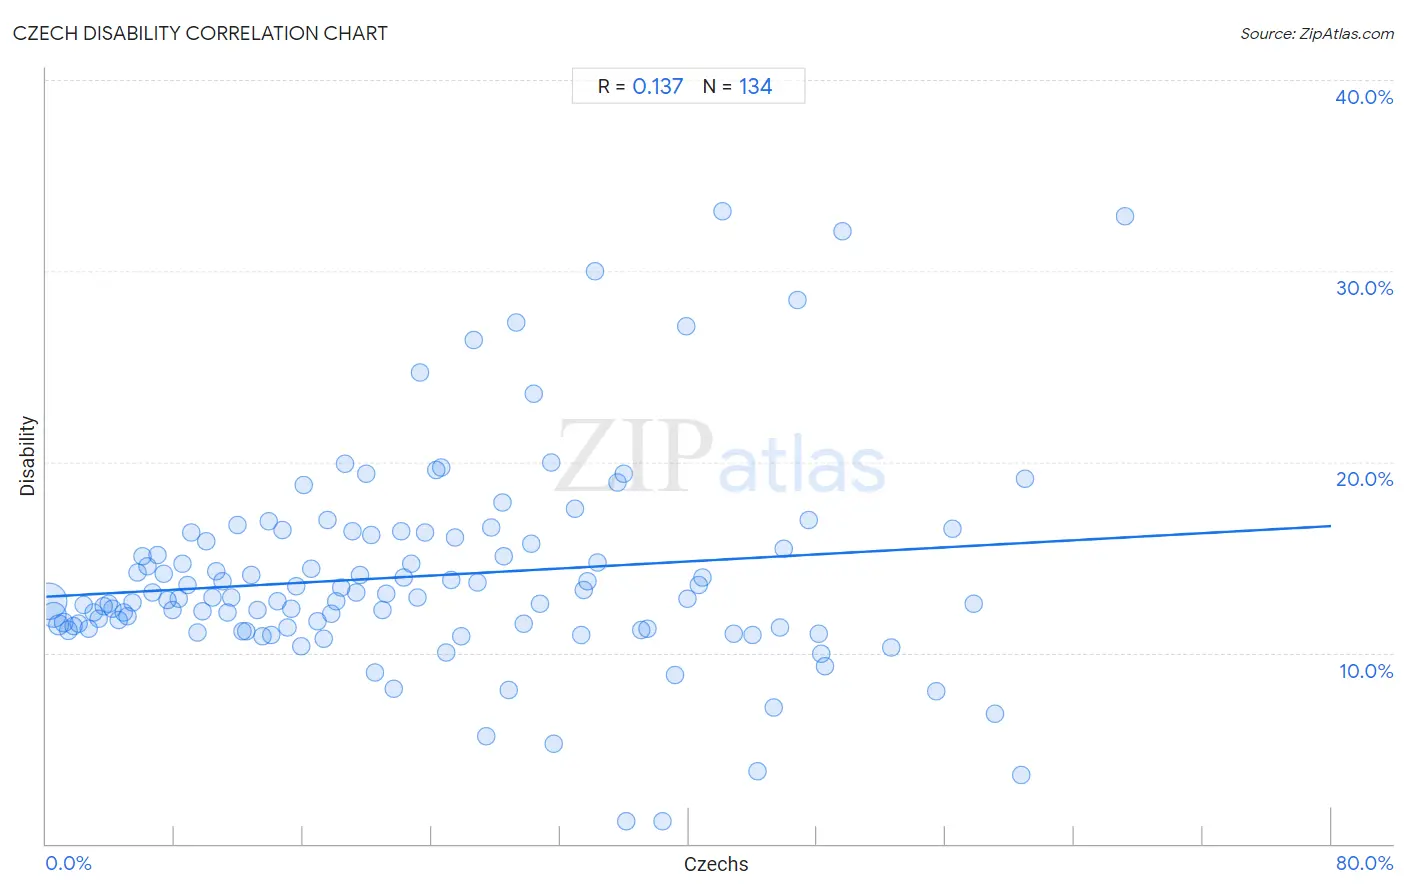
It is essential to understand that the correlation between the percentage of Czechs and percentage of population with a disability does not imply a direct cause-and-effect relationship. It remains uncertain whether the presence of Czechs influences an upward or downward trend in the level of percentage of population with a disability within an area, or if Czechs simply ended up residing in those areas with higher or lower levels of percentage of population with a disability due to other factors.
Demographics Similar to Czechs by Disability
In terms of disability, the demographic groups most similar to Czechs are Immigrants from Cambodia (12.0%, a difference of 0.080%), Austrian (12.0%, a difference of 0.11%), Immigrants from Iraq (12.0%, a difference of 0.11%), Danish (12.0%, a difference of 0.13%), and Immigrants from Somalia (12.0%, a difference of 0.16%).
| Demographics | Rating | Rank | Disability |
| British West Indians | 11.5 /100 | #203 | Poor 12.0% |
| Mexican American Indians | 11.4 /100 | #204 | Poor 12.0% |
| Immigrants from Western Europe | 10.1 /100 | #205 | Poor 12.0% |
| Immigrants from Senegal | 9.4 /100 | #206 | Tragic 12.0% |
| Immigrants from Thailand | 9.3 /100 | #207 | Tragic 12.0% |
| Immigrants from Caribbean | 9.1 /100 | #208 | Tragic 12.0% |
| Danes | 8.7 /100 | #209 | Tragic 12.0% |
| Czechs | 7.9 /100 | #210 | Tragic 12.0% |
| Immigrants from Cambodia | 7.3 /100 | #211 | Tragic 12.0% |
| Austrians | 7.2 /100 | #212 | Tragic 12.0% |
| Immigrants from Iraq | 7.1 /100 | #213 | Tragic 12.0% |
| Immigrants from Somalia | 6.8 /100 | #214 | Tragic 12.0% |
| Immigrants from Canada | 6.1 /100 | #215 | Tragic 12.1% |
| Panamanians | 5.4 /100 | #216 | Tragic 12.1% |
| Immigrants from North America | 5.3 /100 | #217 | Tragic 12.1% |
Czech Disability Correlation Summary
| Measurement | Czech Data | Disability Data |
| Minimum | 0.15% | 1.2% |
| Maximum | 67.2% | 33.1% |
| Range | 67.0% | 31.9% |
| Mean | 23.5% | 14.0% |
| Median | 20.7% | 12.9% |
| Interquartile 25% (IQ1) | 10.4% | 11.3% |
| Interquartile 75% (IQ3) | 34.2% | 16.0% |
| Interquartile Range (IQR) | 23.8% | 4.7% |
| Standard Deviation (Sample) | 16.1% | 5.4% |
| Standard Deviation (Population) | 16.0% | 5.4% |
Correlation Details
| Czech Percentile | Sample Size | Disability |
[ 0.0% - 0.5% ] 0.15% | 277,934,598 | 12.7% |
[ 0.0% - 0.5% ] 0.43% | 115,998,724 | 12.0% |
[ 0.5% - 1.0% ] 0.75% | 39,386,444 | 11.5% |
[ 1.0% - 1.5% ] 1.06% | 19,161,820 | 11.6% |
[ 1.0% - 1.5% ] 1.38% | 10,714,443 | 11.2% |
[ 1.5% - 2.0% ] 1.69% | 6,498,171 | 11.4% |
[ 2.0% - 2.5% ] 2.01% | 4,102,588 | 11.5% |
[ 2.0% - 2.5% ] 2.30% | 2,188,686 | 12.5% |
[ 2.5% - 3.0% ] 2.61% | 1,655,299 | 11.3% |
[ 2.5% - 3.0% ] 2.93% | 1,162,096 | 12.1% |
[ 3.0% - 3.5% ] 3.23% | 1,303,257 | 11.8% |
[ 3.5% - 4.0% ] 3.55% | 605,142 | 12.4% |
[ 3.5% - 4.0% ] 3.88% | 432,857 | 12.5% |
[ 4.0% - 4.5% ] 4.14% | 616,398 | 12.3% |
[ 4.0% - 4.5% ] 4.49% | 629,152 | 11.7% |
[ 4.5% - 5.0% ] 4.79% | 461,433 | 12.1% |
[ 5.0% - 5.5% ] 5.06% | 314,309 | 11.9% |
[ 5.0% - 5.5% ] 5.36% | 274,010 | 12.6% |
[ 5.5% - 6.0% ] 5.65% | 89,927 | 14.2% |
[ 5.5% - 6.0% ] 6.00% | 98,446 | 15.1% |
[ 6.0% - 6.5% ] 6.30% | 77,111 | 14.5% |
[ 6.5% - 7.0% ] 6.62% | 130,377 | 13.2% |
[ 6.5% - 7.0% ] 6.96% | 68,832 | 15.2% |
[ 7.0% - 7.5% ] 7.31% | 77,993 | 14.1% |
[ 7.5% - 8.0% ] 7.55% | 78,471 | 12.8% |
[ 7.5% - 8.0% ] 7.85% | 70,627 | 12.2% |
[ 8.0% - 8.5% ] 8.23% | 65,400 | 12.8% |
[ 8.0% - 8.5% ] 8.47% | 48,658 | 14.7% |
[ 8.5% - 9.0% ] 8.81% | 32,062 | 13.5% |
[ 9.0% - 9.5% ] 9.06% | 14,705 | 16.3% |
[ 9.0% - 9.5% ] 9.41% | 14,846 | 11.0% |
[ 9.5% - 10.0% ] 9.70% | 24,377 | 12.2% |
[ 9.5% - 10.0% ] 9.98% | 21,970 | 15.8% |
[ 10.0% - 10.5% ] 10.35% | 28,249 | 12.9% |
[ 10.5% - 11.0% ] 10.61% | 12,693 | 14.3% |
[ 10.5% - 11.0% ] 10.97% | 35,400 | 13.7% |
[ 11.0% - 11.5% ] 11.26% | 31,937 | 12.1% |
[ 11.5% - 12.0% ] 11.55% | 10,620 | 12.9% |
[ 11.5% - 12.0% ] 11.87% | 7,077 | 16.7% |
[ 12.0% - 12.5% ] 12.20% | 16,076 | 11.2% |
[ 12.0% - 12.5% ] 12.44% | 11,885 | 11.2% |
[ 12.5% - 13.0% ] 12.77% | 9,407 | 14.1% |
[ 13.0% - 13.5% ] 13.12% | 5,837 | 12.2% |
[ 13.0% - 13.5% ] 13.49% | 13,530 | 10.8% |
[ 13.5% - 14.0% ] 13.86% | 2,049 | 16.9% |
[ 13.5% - 14.0% ] 13.99% | 26,728 | 10.9% |
[ 14.0% - 14.5% ] 14.41% | 10,427 | 12.7% |
[ 14.5% - 15.0% ] 14.72% | 6,332 | 16.4% |
[ 15.0% - 15.5% ] 15.05% | 12,715 | 11.3% |
[ 15.0% - 15.5% ] 15.26% | 3,991 | 12.3% |
[ 15.5% - 16.0% ] 15.60% | 20,101 | 13.5% |
[ 15.5% - 16.0% ] 15.86% | 4,060 | 10.4% |
[ 16.0% - 16.5% ] 16.06% | 965 | 18.8% |
[ 16.0% - 16.5% ] 16.50% | 1,600 | 14.4% |
[ 16.5% - 17.0% ] 16.87% | 5,051 | 11.7% |
[ 17.0% - 17.5% ] 17.26% | 5,688 | 10.7% |
[ 17.0% - 17.5% ] 17.50% | 3,103 | 17.0% |
[ 17.5% - 18.0% ] 17.71% | 7,237 | 12.1% |
[ 18.0% - 18.5% ] 18.04% | 7,688 | 12.7% |
[ 18.0% - 18.5% ] 18.33% | 6,613 | 13.4% |
[ 18.5% - 19.0% ] 18.62% | 1,391 | 19.9% |
[ 19.0% - 19.5% ] 19.07% | 367 | 16.3% |
[ 19.0% - 19.5% ] 19.30% | 2,243 | 13.2% |
[ 19.5% - 20.0% ] 19.56% | 2,086 | 14.1% |
[ 19.5% - 20.0% ] 19.94% | 351 | 19.4% |
[ 20.0% - 20.5% ] 20.23% | 2,027 | 16.2% |
[ 20.0% - 20.5% ] 20.49% | 7,247 | 9.0% |
[ 20.5% - 21.0% ] 20.91% | 1,889 | 12.2% |
[ 21.0% - 21.5% ] 21.16% | 7,901 | 13.1% |
[ 21.5% - 22.0% ] 21.66% | 2,105 | 8.1% |
[ 22.0% - 22.5% ] 22.08% | 874 | 16.4% |
[ 22.0% - 22.5% ] 22.28% | 7,132 | 13.9% |
[ 22.5% - 23.0% ] 22.72% | 471 | 14.6% |
[ 23.0% - 23.5% ] 23.08% | 1,300 | 12.9% |
[ 23.0% - 23.5% ] 23.29% | 73 | 24.7% |
[ 23.5% - 24.0% ] 23.55% | 9,075 | 16.3% |
[ 24.0% - 24.5% ] 24.26% | 878 | 19.6% |
[ 24.5% - 25.0% ] 24.62% | 1,653 | 19.7% |
[ 24.5% - 25.0% ] 24.90% | 510 | 10.0% |
[ 25.0% - 25.5% ] 25.22% | 4,037 | 13.8% |
[ 25.0% - 25.5% ] 25.41% | 181 | 16.0% |
[ 25.5% - 26.0% ] 25.84% | 1,676 | 10.9% |
[ 26.5% - 27.0% ] 26.59% | 425 | 26.4% |
[ 26.5% - 27.0% ] 26.89% | 212 | 13.7% |
[ 27.0% - 27.5% ] 27.41% | 321 | 5.6% |
[ 27.5% - 28.0% ] 27.72% | 2,244 | 16.5% |
[ 28.0% - 28.5% ] 28.40% | 514 | 17.9% |
[ 28.5% - 29.0% ] 28.51% | 7,766 | 15.1% |
[ 28.5% - 29.0% ] 28.81% | 236 | 8.1% |
[ 29.0% - 29.5% ] 29.29% | 99 | 27.3% |
[ 29.5% - 30.0% ] 29.76% | 1,929 | 11.5% |
[ 30.0% - 30.5% ] 30.19% | 5,088 | 15.7% |
[ 30.0% - 30.5% ] 30.38% | 609 | 23.6% |
[ 30.5% - 31.0% ] 30.72% | 1,618 | 12.5% |
[ 31.0% - 31.5% ] 31.44% | 776 | 20.0% |
[ 31.5% - 32.0% ] 31.58% | 361 | 5.3% |
[ 32.5% - 33.0% ] 32.94% | 513 | 17.5% |
[ 33.0% - 33.5% ] 33.33% | 183 | 10.9% |
[ 33.0% - 33.5% ] 33.48% | 1,643 | 13.3% |
[ 33.5% - 34.0% ] 33.71% | 5,443 | 13.8% |
[ 34.0% - 34.5% ] 34.17% | 120 | 30.0% |
[ 34.0% - 34.5% ] 34.31% | 204 | 14.7% |
[ 35.5% - 36.0% ] 35.60% | 663 | 18.9% |
[ 35.5% - 36.0% ] 35.97% | 620 | 19.4% |
[ 36.0% - 36.5% ] 36.14% | 166 | 1.2% |
[ 37.0% - 37.5% ] 37.03% | 1,345 | 11.2% |
[ 37.0% - 37.5% ] 37.45% | 275 | 11.3% |
[ 38.0% - 38.5% ] 38.37% | 86 | 1.2% |
[ 39.0% - 39.5% ] 39.14% | 350 | 8.9% |
[ 39.5% - 40.0% ] 39.83% | 118 | 27.1% |
[ 39.5% - 40.0% ] 39.95% | 2,095 | 12.8% |
[ 40.5% - 41.0% ] 40.59% | 2,237 | 13.6% |
[ 40.5% - 41.0% ] 40.87% | 115 | 13.9% |
[ 42.0% - 42.5% ] 42.07% | 290 | 33.1% |
[ 42.5% - 43.0% ] 42.83% | 635 | 11.0% |
[ 43.5% - 44.0% ] 43.97% | 630 | 11.0% |
[ 44.0% - 44.5% ] 44.30% | 79 | 3.8% |
[ 45.0% - 45.5% ] 45.29% | 616 | 7.1% |
[ 45.5% - 46.0% ] 45.66% | 679 | 11.3% |
[ 45.5% - 46.0% ] 45.90% | 427 | 15.5% |
[ 46.5% - 47.0% ] 46.81% | 376 | 28.5% |
[ 47.0% - 47.5% ] 47.46% | 118 | 16.9% |
[ 48.0% - 48.5% ] 48.09% | 601 | 11.0% |
[ 48.0% - 48.5% ] 48.25% | 342 | 9.9% |
[ 48.0% - 48.5% ] 48.49% | 365 | 9.3% |
[ 49.5% - 50.0% ] 49.54% | 109 | 32.1% |
[ 52.5% - 53.0% ] 52.57% | 253 | 10.3% |
[ 55.0% - 55.5% ] 55.38% | 251 | 8.0% |
[ 56.0% - 56.5% ] 56.39% | 454 | 16.5% |
[ 57.5% - 58.0% ] 57.78% | 135 | 12.6% |
[ 59.0% - 59.5% ] 59.09% | 44 | 6.8% |
[ 60.5% - 61.0% ] 60.71% | 56 | 3.6% |
[ 60.5% - 61.0% ] 60.90% | 335 | 19.1% |
[ 67.0% - 67.5% ] 67.15% | 137 | 32.8% |