Blackfeet GED/Equivalency
COMPARE
Blackfeet
Select to Compare
GED/Equivalency
Blackfeet GED/Equivalency
83.8%
GED/EQUIVALENCY
1.1/ 100
METRIC RATING
248th/ 347
METRIC RANK
Blackfeet GED/Equivalency Correlation Chart
The statistical analysis conducted on geographies consisting of 309,582,068 people shows a weak negative correlation between the proportion of Blackfeet and percentage of population with at least ged/equivalency education in the United States with a correlation coefficient (R) of -0.264 and weighted average of 83.8%. On average, for every 1% (one percent) increase in Blackfeet within a typical geography, there is a decrease of 0.091% in percentage of population with at least ged/equivalency education.
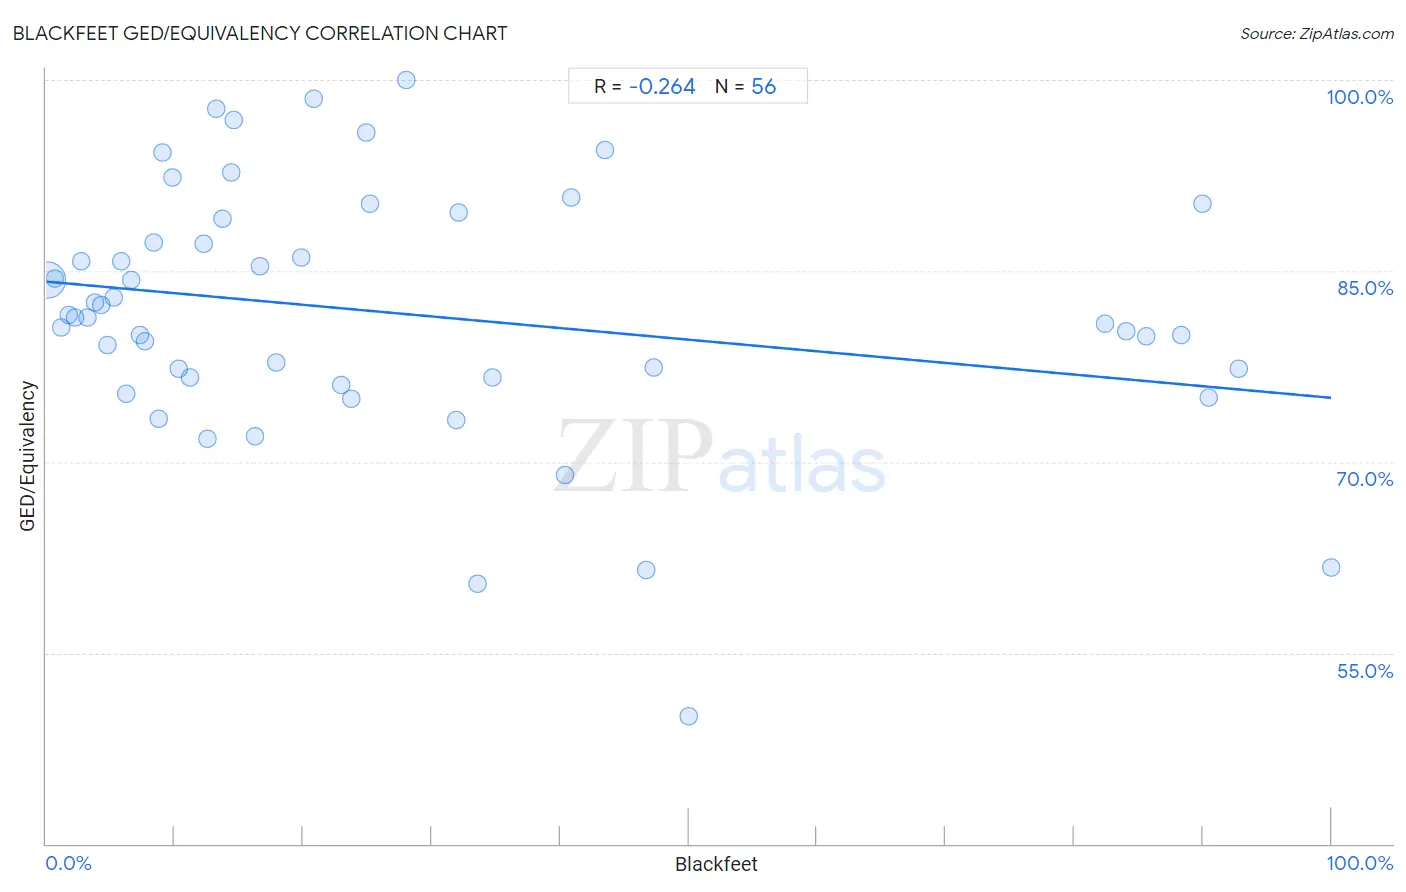
It is essential to understand that the correlation between the percentage of Blackfeet and percentage of population with at least ged/equivalency education does not imply a direct cause-and-effect relationship. It remains uncertain whether the presence of Blackfeet influences an upward or downward trend in the level of percentage of population with at least ged/equivalency education within an area, or if Blackfeet simply ended up residing in those areas with higher or lower levels of percentage of population with at least ged/equivalency education due to other factors.
Demographics Similar to Blackfeet by GED/Equivalency
In terms of ged/equivalency, the demographic groups most similar to Blackfeet are Crow (83.8%, a difference of 0.010%), Immigrants from Western Africa (83.8%, a difference of 0.020%), Shoshone (83.7%, a difference of 0.020%), Chickasaw (83.8%, a difference of 0.050%), and Immigrants from Senegal (83.8%, a difference of 0.070%).
| Demographics | Rating | Rank | GED/Equivalency |
| Senegalese | 1.9 /100 | #241 | Tragic 84.0% |
| Sri Lankans | 1.9 /100 | #242 | Tragic 84.0% |
| Cherokee | 1.3 /100 | #243 | Tragic 83.9% |
| Immigrants from Ghana | 1.3 /100 | #244 | Tragic 83.9% |
| Immigrants from Senegal | 1.2 /100 | #245 | Tragic 83.8% |
| Chickasaw | 1.2 /100 | #246 | Tragic 83.8% |
| Immigrants from Western Africa | 1.1 /100 | #247 | Tragic 83.8% |
| Blackfeet | 1.1 /100 | #248 | Tragic 83.8% |
| Crow | 1.1 /100 | #249 | Tragic 83.8% |
| Shoshone | 1.0 /100 | #250 | Tragic 83.7% |
| Spanish Americans | 0.8 /100 | #251 | Tragic 83.6% |
| Bahamians | 0.8 /100 | #252 | Tragic 83.6% |
| Comanche | 0.7 /100 | #253 | Tragic 83.6% |
| Creek | 0.7 /100 | #254 | Tragic 83.6% |
| Colville | 0.5 /100 | #255 | Tragic 83.4% |
Blackfeet GED/Equivalency Correlation Summary
| Measurement | Blackfeet Data | GED/Equivalency Data |
| Minimum | 0.088% | 50.0% |
| Maximum | 100.0% | 100.0% |
| Range | 99.9% | 50.0% |
| Mean | 27.4% | 81.7% |
| Median | 15.4% | 81.4% |
| Interquartile 25% (IQ1) | 7.0% | 76.6% |
| Interquartile 75% (IQ3) | 37.6% | 88.2% |
| Interquartile Range (IQR) | 30.6% | 11.6% |
| Standard Deviation (Sample) | 28.7% | 9.9% |
| Standard Deviation (Population) | 28.4% | 9.8% |
Correlation Details
| Blackfeet Percentile | Sample Size | GED/Equivalency |
[ 0.0% - 0.5% ] 0.088% | 300,855,536 | 84.3% |
[ 0.5% - 1.0% ] 0.68% | 6,548,177 | 84.4% |
[ 1.0% - 1.5% ] 1.21% | 993,982 | 80.6% |
[ 1.5% - 2.0% ] 1.73% | 684,215 | 81.6% |
[ 2.0% - 2.5% ] 2.20% | 216,637 | 81.4% |
[ 2.5% - 3.0% ] 2.69% | 76,209 | 85.8% |
[ 3.0% - 3.5% ] 3.23% | 47,117 | 81.4% |
[ 3.5% - 4.0% ] 3.76% | 30,080 | 82.5% |
[ 4.0% - 4.5% ] 4.26% | 32,829 | 82.3% |
[ 4.5% - 5.0% ] 4.72% | 8,304 | 79.2% |
[ 5.0% - 5.5% ] 5.29% | 8,429 | 82.9% |
[ 5.5% - 6.0% ] 5.82% | 14,933 | 85.7% |
[ 6.0% - 6.5% ] 6.26% | 9,663 | 75.4% |
[ 6.5% - 7.0% ] 6.64% | 5,107 | 84.3% |
[ 7.0% - 7.5% ] 7.26% | 4,213 | 79.9% |
[ 7.5% - 8.0% ] 7.67% | 4,081 | 79.5% |
[ 8.0% - 8.5% ] 8.39% | 3,136 | 87.2% |
[ 8.5% - 9.0% ] 8.80% | 2,148 | 73.4% |
[ 9.0% - 9.5% ] 9.07% | 375 | 94.3% |
[ 9.5% - 10.0% ] 9.80% | 1,326 | 92.4% |
[ 10.0% - 10.5% ] 10.32% | 853 | 77.3% |
[ 11.0% - 11.5% ] 11.19% | 2,538 | 76.6% |
[ 12.0% - 12.5% ] 12.24% | 147 | 87.1% |
[ 12.5% - 13.0% ] 12.58% | 1,240 | 71.8% |
[ 13.0% - 13.5% ] 13.20% | 197 | 97.8% |
[ 13.5% - 14.0% ] 13.72% | 860 | 89.1% |
[ 14.0% - 14.5% ] 14.37% | 167 | 92.7% |
[ 14.5% - 15.0% ] 14.58% | 240 | 96.9% |
[ 16.0% - 16.5% ] 16.28% | 1,253 | 72.0% |
[ 16.5% - 17.0% ] 16.67% | 534 | 85.4% |
[ 17.5% - 18.0% ] 17.94% | 3,061 | 77.8% |
[ 19.5% - 20.0% ] 19.83% | 116 | 86.0% |
[ 20.5% - 21.0% ] 20.83% | 120 | 98.5% |
[ 22.5% - 23.0% ] 22.98% | 5,008 | 76.1% |
[ 23.5% - 24.0% ] 23.75% | 480 | 75.0% |
[ 24.5% - 25.0% ] 24.88% | 414 | 95.8% |
[ 25.0% - 25.5% ] 25.15% | 163 | 90.3% |
[ 28.0% - 28.5% ] 28.00% | 50 | 100.0% |
[ 31.5% - 32.0% ] 31.95% | 241 | 73.3% |
[ 32.0% - 32.5% ] 32.07% | 343 | 89.6% |
[ 33.5% - 34.0% ] 33.61% | 244 | 60.4% |
[ 34.5% - 35.0% ] 34.78% | 1,317 | 76.6% |
[ 40.0% - 40.5% ] 40.40% | 151 | 68.9% |
[ 40.5% - 41.0% ] 40.90% | 863 | 90.8% |
[ 43.0% - 43.5% ] 43.48% | 69 | 94.5% |
[ 46.5% - 47.0% ] 46.67% | 15 | 61.5% |
[ 47.0% - 47.5% ] 47.23% | 271 | 77.4% |
[ 50.0% - 50.5% ] 50.00% | 4 | 50.0% |
[ 82.0% - 82.5% ] 82.35% | 1,654 | 80.9% |
[ 84.0% - 84.5% ] 84.09% | 7,532 | 80.3% |
[ 85.5% - 86.0% ] 85.65% | 871 | 79.9% |
[ 88.0% - 88.5% ] 88.34% | 3,001 | 79.9% |
[ 89.5% - 90.0% ] 89.96% | 229 | 90.3% |
[ 90.0% - 90.5% ] 90.43% | 690 | 75.1% |
[ 92.5% - 93.0% ] 92.78% | 554 | 77.4% |
[ 99.5% - 100.0% ] 100.00% | 81 | 61.7% |