Blackfeet 4 or more Vehicles in Household
COMPARE
Blackfeet
Select to Compare
4 or more Vehicles in Household
Blackfeet 4 or more Vehicles in Household
7.0%
4+ VEHICLES AVAILABLE
98.6/ 100
METRIC RATING
103rd/ 347
METRIC RANK
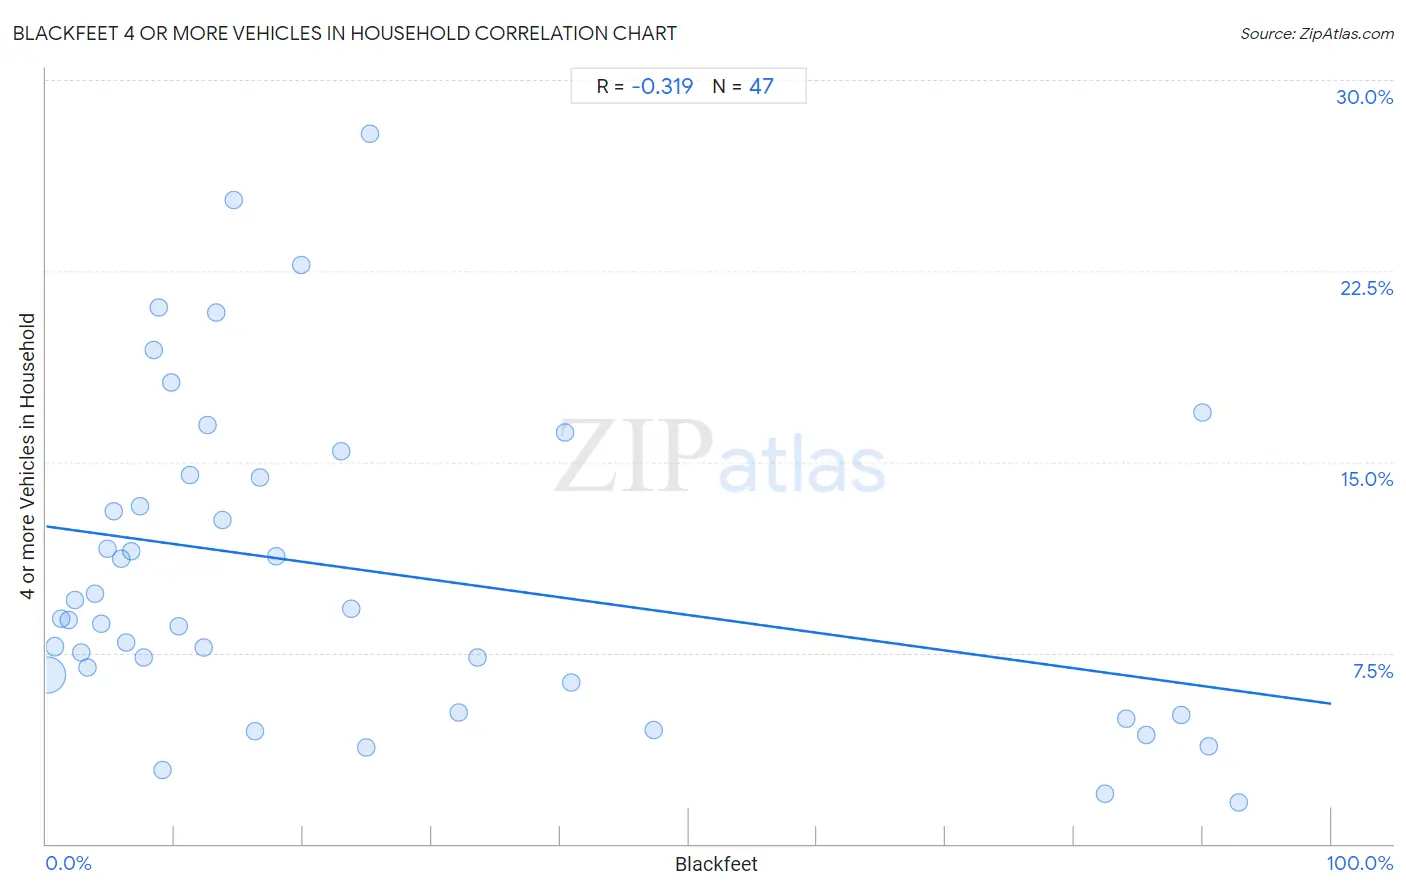
Blackfeet 4 or more Vehicles in Household Correlation Chart
The statistical analysis conducted on geographies consisting of 308,735,015 people shows a mild negative correlation between the proportion of Blackfeet and percentage of households with 4 or more vehicles available in the United States with a correlation coefficient (R) of -0.319 and weighted average of 7.0%. On average, for every 1% (one percent) increase in Blackfeet within a typical geography, there is a decrease of 0.070% in percentage of households with 4 or more vehicles available.
It is essential to understand that the correlation between the percentage of Blackfeet and percentage of households with 4 or more vehicles available does not imply a direct cause-and-effect relationship. It remains uncertain whether the presence of Blackfeet influences an upward or downward trend in the level of percentage of households with 4 or more vehicles available within an area, or if Blackfeet simply ended up residing in those areas with higher or lower levels of percentage of households with 4 or more vehicles available due to other factors.
Demographics Similar to Blackfeet by 4 or more Vehicles in Household
In terms of 4 or more vehicles in household, the demographic groups most similar to Blackfeet are Asian (7.0%, a difference of 0.010%), Pakistani (7.0%, a difference of 0.080%), Taiwanese (7.0%, a difference of 0.15%), Seminole (7.0%, a difference of 0.22%), and Hmong (7.0%, a difference of 0.48%).
| Demographics | Rating | Rank | 4 or more Vehicles in Household |
| Central Americans | 99.3 /100 | #96 | Exceptional 7.1% |
| Celtics | 99.1 /100 | #97 | Exceptional 7.1% |
| Irish | 99.0 /100 | #98 | Exceptional 7.1% |
| Seminole | 98.8 /100 | #99 | Exceptional 7.0% |
| Taiwanese | 98.7 /100 | #100 | Exceptional 7.0% |
| Pakistanis | 98.7 /100 | #101 | Exceptional 7.0% |
| Asians | 98.6 /100 | #102 | Exceptional 7.0% |
| Blackfeet | 98.6 /100 | #103 | Exceptional 7.0% |
| Hmong | 98.3 /100 | #104 | Exceptional 7.0% |
| German Russians | 98.3 /100 | #105 | Exceptional 7.0% |
| Guatemalans | 98.1 /100 | #106 | Exceptional 7.0% |
| Nicaraguans | 98.0 /100 | #107 | Exceptional 7.0% |
| French | 97.7 /100 | #108 | Exceptional 6.9% |
| Filipinos | 97.6 /100 | #109 | Exceptional 6.9% |
| Immigrants from Thailand | 97.0 /100 | #110 | Exceptional 6.9% |
Blackfeet 4 or more Vehicles in Household Correlation Summary
| Measurement | Blackfeet Data | 4 or more Vehicles in Household Data |
| Minimum | 0.088% | 1.6% |
| Maximum | 92.8% | 27.9% |
| Range | 92.7% | 26.3% |
| Mean | 24.7% | 10.7% |
| Median | 12.5% | 8.8% |
| Interquartile 25% (IQ1) | 5.8% | 6.3% |
| Interquartile 75% (IQ3) | 32.1% | 14.5% |
| Interquartile Range (IQR) | 26.2% | 8.2% |
| Standard Deviation (Sample) | 28.8% | 6.3% |
| Standard Deviation (Population) | 28.5% | 6.2% |
Correlation Details
| Blackfeet Percentile | Sample Size | 4 or more Vehicles in Household |
[ 0.0% - 0.5% ] 0.088% | 300,110,583 | 6.6% |
[ 0.5% - 1.0% ] 0.68% | 6,493,991 | 7.7% |
[ 1.0% - 1.5% ] 1.21% | 977,480 | 8.8% |
[ 1.5% - 2.0% ] 1.73% | 675,893 | 8.8% |
[ 2.0% - 2.5% ] 2.20% | 207,793 | 9.6% |
[ 2.5% - 3.0% ] 2.69% | 74,319 | 7.5% |
[ 3.0% - 3.5% ] 3.23% | 44,876 | 6.9% |
[ 3.5% - 4.0% ] 3.76% | 28,443 | 9.8% |
[ 4.0% - 4.5% ] 4.26% | 32,829 | 8.6% |
[ 4.5% - 5.0% ] 4.73% | 7,756 | 11.6% |
[ 5.0% - 5.5% ] 5.28% | 8,005 | 13.1% |
[ 5.5% - 6.0% ] 5.82% | 13,348 | 11.2% |
[ 6.0% - 6.5% ] 6.26% | 9,228 | 7.9% |
[ 6.5% - 7.0% ] 6.64% | 5,107 | 11.5% |
[ 7.0% - 7.5% ] 7.26% | 4,079 | 13.3% |
[ 7.5% - 8.0% ] 7.63% | 3,157 | 7.3% |
[ 8.0% - 8.5% ] 8.41% | 2,034 | 19.4% |
[ 8.5% - 9.0% ] 8.80% | 2,148 | 21.1% |
[ 9.0% - 9.5% ] 9.01% | 322 | 2.9% |
[ 9.5% - 10.0% ] 9.69% | 671 | 18.1% |
[ 10.0% - 10.5% ] 10.32% | 853 | 8.5% |
[ 11.0% - 11.5% ] 11.19% | 2,538 | 14.5% |
[ 12.0% - 12.5% ] 12.26% | 106 | 7.7% |
[ 12.5% - 13.0% ] 12.53% | 974 | 16.4% |
[ 13.0% - 13.5% ] 13.20% | 197 | 20.9% |
[ 13.5% - 14.0% ] 13.72% | 860 | 12.7% |
[ 14.5% - 15.0% ] 14.58% | 240 | 25.3% |
[ 16.0% - 16.5% ] 16.28% | 1,087 | 4.4% |
[ 16.5% - 17.0% ] 16.67% | 534 | 14.4% |
[ 17.5% - 18.0% ] 17.94% | 3,061 | 11.3% |
[ 19.5% - 20.0% ] 19.83% | 116 | 22.7% |
[ 22.5% - 23.0% ] 22.98% | 5,008 | 15.4% |
[ 23.5% - 24.0% ] 23.75% | 480 | 9.3% |
[ 24.5% - 25.0% ] 24.88% | 414 | 3.8% |
[ 25.0% - 25.5% ] 25.15% | 163 | 27.9% |
[ 32.0% - 32.5% ] 32.06% | 262 | 5.1% |
[ 33.5% - 34.0% ] 33.61% | 244 | 7.3% |
[ 40.0% - 40.5% ] 40.40% | 151 | 16.2% |
[ 40.5% - 41.0% ] 40.90% | 863 | 6.3% |
[ 47.0% - 47.5% ] 47.23% | 271 | 4.5% |
[ 82.0% - 82.5% ] 82.35% | 1,654 | 2.0% |
[ 84.0% - 84.5% ] 84.09% | 7,532 | 4.9% |
[ 85.5% - 86.0% ] 85.65% | 871 | 4.3% |
[ 88.0% - 88.5% ] 88.34% | 3,001 | 5.1% |
[ 89.5% - 90.0% ] 89.96% | 229 | 16.9% |
[ 90.0% - 90.5% ] 90.43% | 690 | 3.8% |
[ 92.5% - 93.0% ] 92.78% | 554 | 1.6% |