Blackfeet 3 or more Vehicles in Household
COMPARE
Blackfeet
Select to Compare
3 or more Vehicles in Household
Blackfeet 3 or more Vehicles in Household
20.9%
3+ VEHICLES AVAILABLE
97.9/ 100
METRIC RATING
101st/ 347
METRIC RANK
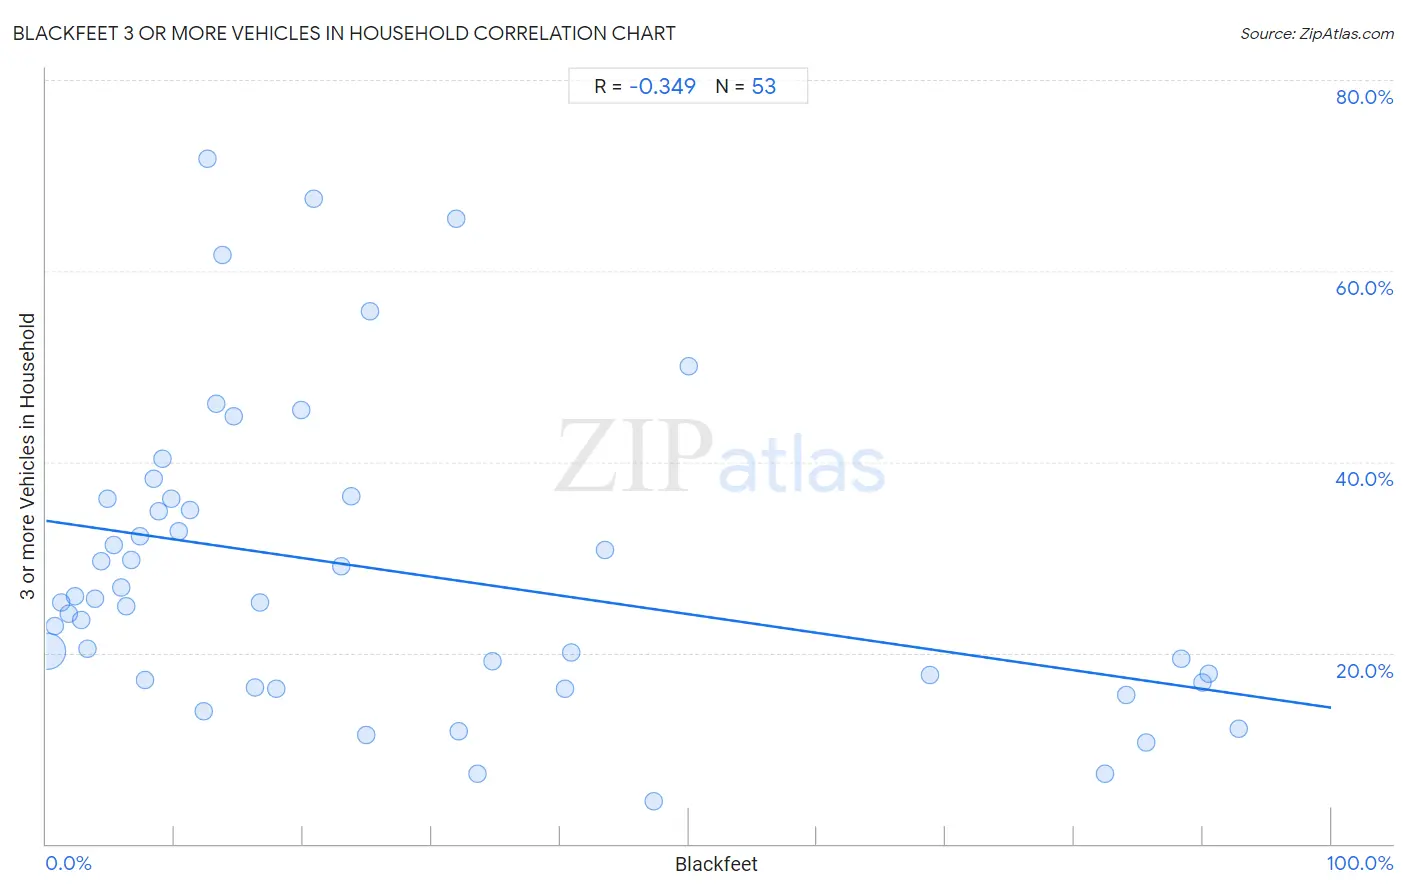
Blackfeet 3 or more Vehicles in Household Correlation Chart
The statistical analysis conducted on geographies consisting of 309,447,787 people shows a mild negative correlation between the proportion of Blackfeet and percentage of households with 3 or more vehicles available in the United States with a correlation coefficient (R) of -0.349 and weighted average of 20.9%. On average, for every 1% (one percent) increase in Blackfeet within a typical geography, there is a decrease of 0.20% in percentage of households with 3 or more vehicles available.
It is essential to understand that the correlation between the percentage of Blackfeet and percentage of households with 3 or more vehicles available does not imply a direct cause-and-effect relationship. It remains uncertain whether the presence of Blackfeet influences an upward or downward trend in the level of percentage of households with 3 or more vehicles available within an area, or if Blackfeet simply ended up residing in those areas with higher or lower levels of percentage of households with 3 or more vehicles available due to other factors.
Demographics Similar to Blackfeet by 3 or more Vehicles in Household
In terms of 3 or more vehicles in household, the demographic groups most similar to Blackfeet are Seminole (20.9%, a difference of 0.030%), Dutch West Indian (20.9%, a difference of 0.070%), Luxembourger (20.9%, a difference of 0.15%), Austrian (20.9%, a difference of 0.25%), and Comanche (21.0%, a difference of 0.31%).
| Demographics | Rating | Rank | 3 or more Vehicles in Household |
| Immigrants from Cambodia | 98.6 /100 | #94 | Exceptional 21.1% |
| Pakistanis | 98.5 /100 | #95 | Exceptional 21.0% |
| Cree | 98.4 /100 | #96 | Exceptional 21.0% |
| Canadians | 98.3 /100 | #97 | Exceptional 21.0% |
| Hmong | 98.2 /100 | #98 | Exceptional 21.0% |
| Alaska Natives | 98.2 /100 | #99 | Exceptional 21.0% |
| Comanche | 98.2 /100 | #100 | Exceptional 21.0% |
| Blackfeet | 97.9 /100 | #101 | Exceptional 20.9% |
| Seminole | 97.8 /100 | #102 | Exceptional 20.9% |
| Dutch West Indians | 97.8 /100 | #103 | Exceptional 20.9% |
| Luxembourgers | 97.7 /100 | #104 | Exceptional 20.9% |
| Austrians | 97.5 /100 | #105 | Exceptional 20.9% |
| Bolivians | 97.4 /100 | #106 | Exceptional 20.8% |
| Immigrants from Germany | 97.4 /100 | #107 | Exceptional 20.8% |
| Immigrants from Scotland | 97.1 /100 | #108 | Exceptional 20.8% |
Blackfeet 3 or more Vehicles in Household Correlation Summary
| Measurement | Blackfeet Data | 3 or more Vehicles in Household Data |
| Minimum | 0.088% | 4.5% |
| Maximum | 92.8% | 71.7% |
| Range | 92.7% | 67.2% |
| Mean | 26.6% | 28.6% |
| Median | 14.6% | 25.3% |
| Interquartile 25% (IQ1) | 6.4% | 17.1% |
| Interquartile 75% (IQ3) | 37.6% | 36.1% |
| Interquartile Range (IQR) | 31.1% | 19.1% |
| Standard Deviation (Sample) | 28.1% | 15.8% |
| Standard Deviation (Population) | 27.8% | 15.6% |
Correlation Details
| Blackfeet Percentile | Sample Size | 3 or more Vehicles in Household |
[ 0.0% - 0.5% ] 0.088% | 300,741,817 | 20.1% |
[ 0.5% - 1.0% ] 0.68% | 6,541,774 | 22.8% |
[ 1.0% - 1.5% ] 1.21% | 986,690 | 25.2% |
[ 1.5% - 2.0% ] 1.73% | 681,991 | 24.1% |
[ 2.0% - 2.5% ] 2.20% | 215,645 | 25.9% |
[ 2.5% - 3.0% ] 2.69% | 76,209 | 23.4% |
[ 3.0% - 3.5% ] 3.23% | 47,117 | 20.4% |
[ 3.5% - 4.0% ] 3.76% | 28,981 | 25.7% |
[ 4.0% - 4.5% ] 4.26% | 32,829 | 29.6% |
[ 4.5% - 5.0% ] 4.73% | 8,105 | 36.1% |
[ 5.0% - 5.5% ] 5.29% | 8,283 | 31.3% |
[ 5.5% - 6.0% ] 5.82% | 14,143 | 26.8% |
[ 6.0% - 6.5% ] 6.26% | 9,647 | 24.9% |
[ 6.5% - 7.0% ] 6.64% | 5,107 | 29.7% |
[ 7.0% - 7.5% ] 7.26% | 4,079 | 32.3% |
[ 7.5% - 8.0% ] 7.67% | 3,965 | 17.2% |
[ 8.0% - 8.5% ] 8.39% | 3,136 | 38.3% |
[ 8.5% - 9.0% ] 8.80% | 2,148 | 34.9% |
[ 9.0% - 9.5% ] 9.07% | 375 | 40.3% |
[ 9.5% - 10.0% ] 9.69% | 671 | 36.2% |
[ 10.0% - 10.5% ] 10.32% | 853 | 32.8% |
[ 11.0% - 11.5% ] 11.19% | 2,538 | 35.0% |
[ 12.0% - 12.5% ] 12.24% | 147 | 13.8% |
[ 12.5% - 13.0% ] 12.58% | 1,240 | 71.7% |
[ 13.0% - 13.5% ] 13.20% | 197 | 46.2% |
[ 13.5% - 14.0% ] 13.72% | 860 | 61.6% |
[ 14.5% - 15.0% ] 14.58% | 240 | 44.8% |
[ 16.0% - 16.5% ] 16.28% | 1,087 | 16.4% |
[ 16.5% - 17.0% ] 16.67% | 534 | 25.3% |
[ 17.5% - 18.0% ] 17.94% | 3,061 | 16.2% |
[ 19.5% - 20.0% ] 19.83% | 116 | 45.5% |
[ 20.5% - 21.0% ] 20.83% | 120 | 67.5% |
[ 22.5% - 23.0% ] 22.98% | 5,008 | 29.0% |
[ 23.5% - 24.0% ] 23.75% | 480 | 36.3% |
[ 24.5% - 25.0% ] 24.88% | 414 | 11.4% |
[ 25.0% - 25.5% ] 25.15% | 163 | 55.7% |
[ 31.5% - 32.0% ] 31.95% | 241 | 65.5% |
[ 32.0% - 32.5% ] 32.06% | 262 | 11.8% |
[ 33.5% - 34.0% ] 33.61% | 244 | 7.3% |
[ 34.5% - 35.0% ] 34.78% | 1,317 | 19.1% |
[ 40.0% - 40.5% ] 40.40% | 151 | 16.2% |
[ 40.5% - 41.0% ] 40.90% | 863 | 20.0% |
[ 43.0% - 43.5% ] 43.48% | 69 | 30.8% |
[ 47.0% - 47.5% ] 47.23% | 271 | 4.5% |
[ 50.0% - 50.5% ] 50.00% | 4 | 50.0% |
[ 68.5% - 69.0% ] 68.75% | 64 | 17.6% |
[ 82.0% - 82.5% ] 82.35% | 1,654 | 7.3% |
[ 84.0% - 84.5% ] 84.09% | 7,532 | 15.6% |
[ 85.5% - 86.0% ] 85.65% | 871 | 10.6% |
[ 88.0% - 88.5% ] 88.34% | 3,001 | 19.4% |
[ 89.5% - 90.0% ] 89.96% | 229 | 16.9% |
[ 90.0% - 90.5% ] 90.43% | 690 | 17.8% |
[ 92.5% - 93.0% ] 92.78% | 554 | 12.0% |