Blackfeet 11th Grade

COMPARE

Blackfeet
Race
Ancestry
AfghanAfricanAlaska NativeAlaskan AthabascanAlbanianAleutAlsatianAmericanApacheArabArapahoArgentineanArmenianAssyrian/Chaldean/SyriacAustralianAustrianBahamianBangladeshiBarbadianBasqueBelgianBelizeanBermudanBhutaneseBlackfeetBolivianBrazilianBritishBritish West IndianBulgarianBurmeseCajunCambodianCanadianCape VerdeanCarpatho RusynCelticCentral AmericanCentral American IndianCherokeeCheyenneChickasawChileanChineseChippewaChoctawColombianColvilleComancheCosta RicanCreeCreekCroatianCrowCubanCypriotCzechCzechoslovakianDanishDelawareDominicanDutchDutch West IndianEastern EuropeanEcuadorianEgyptianEnglishEstonianEthiopianEuropeanFijianFilipinoFinnishFrenchFrench American IndianFrench CanadianGermanGerman RussianGhanaianGreekGuamanian/ChamorroGuatemalanGuyaneseHaitianHmongHonduranHopiHoumaHungarianIcelanderIndian (Asian)IndonesianInupiatIranianIraqiIrishIroquoisIsraeliItalianJamaicanJapaneseJordanianKenyanKiowaKoreanLaotianLatvianLebaneseLiberianLithuanianLumbeeLuxembourgerMacedonianMalaysianMalteseMarshalleseMenomineeMexicanMexican American IndianMongolianMoroccanNative HawaiianNavajoNepaleseNew ZealanderNicaraguanNigerianNorthern EuropeanNorwegianOkinawanOsageOttawaPaiutePakistaniPalestinianPanamanianParaguayanPennsylvania GermanPeruvianPimaPolishPortuguesePotawatomiPuebloPuerto RicanPuget Sound SalishRomanianRussianSalvadoranSamoanScandinavianScotch-IrishScottishSeminoleSenegaleseSerbianShoshoneSierra LeoneanSiouxSlavicSlovakSloveneSomaliSouth AfricanSouth AmericanSouth American IndianSoviet UnionSpaniardSpanishSpanish AmericanSpanish American IndianSri LankanSubsaharan AfricanSudaneseSwedishSwissSyrianTaiwaneseThaiTlingit-HaidaTohono O'OdhamTonganTrinidadian and TobagonianTsimshianTurkishU.S. Virgin IslanderUgandanUkrainianUruguayanUteVenezuelanVietnameseWelshWest IndianYakamaYaquiYugoslavianYumanYup'ikZimbabwean
Immigration
NonimmigrantsImmigrantsAfghanistanAfricaAlbaniaArgentinaArmeniaAsiaAustraliaAustriaBahamasBangladeshBarbadosBelarusBelgiumBelizeBoliviaBosnia and HerzegovinaBrazilBulgariaBurma/MyanmarCabo VerdeCambodiaCameroonCanadaCaribbeanCentral AmericaChileChinaColombiaCongoCosta RicaCroatiaCubaCzechoslovakiaDenmarkDominicaDominican RepublicEastern AfricaEastern AsiaEastern EuropeEcuadorEgyptEl SalvadorEnglandEritreaEthiopiaEuropeFijiFranceGermanyGhanaGreeceGrenadaGuatemalaGuyanaHaitiHondurasHong KongHungaryIndiaIndonesiaIranIraqIrelandIsraelItalyJamaicaJapanJordanKazakhstanKenyaKoreaKuwaitLaosLatin AmericaLatviaLebanonLiberiaLithuaniaMalaysiaMexicoMicronesiaMiddle AfricaMoldovaMoroccoNepalNetherlandsNicaraguaNigeriaNorth AmericaNorth MacedoniaNorthern AfricaNorthern EuropeNorwayOceaniaPakistanPanamaPeruPhilippinesPolandPortugalRomaniaRussiaSaudi ArabiaScotlandSenegalSerbiaSierra LeoneSingaporeSomaliaSouth AfricaSouth AmericaSouth Central AsiaSouth Eastern AsiaSouthern EuropeSpainSri LankaSt. Vincent and the GrenadinesSudanSwedenSwitzerlandSyriaTaiwanThailandTrinidad and TobagoTurkeyUgandaUkraineUruguayUzbekistanVenezuelaVietnamWest IndiesWestern AfricaWestern AsiaWestern EuropeYemenZaireZimbabweAzores
Select to Compare
Race
Ancestry
AfghanAfricanAlaska NativeAlaskan AthabascanAlbanianAleutAlsatianAmericanApacheArabArapahoArgentineanArmenianAssyrian/Chaldean/SyriacAustralianAustrianBahamianBangladeshiBarbadianBasqueBelgianBelizeanBermudanBhutaneseBolivianBrazilianBritishBritish West IndianBulgarianBurmeseCajunCambodianCanadianCape VerdeanCarpatho RusynCelticCentral AmericanCentral American IndianCherokeeCheyenneChickasawChileanChineseChippewaChoctawColombianColvilleComancheCosta RicanCreeCreekCroatianCrowCubanCypriotCzechCzechoslovakianDanishDelawareDominicanDutchDutch West IndianEastern EuropeanEcuadorianEgyptianEnglishEstonianEthiopianEuropeanFijianFilipinoFinnishFrenchFrench American IndianFrench CanadianGermanGerman RussianGhanaianGreekGuamanian/ChamorroGuatemalanGuyaneseHaitianHmongHonduranHopiHoumaHungarianIcelanderIndian (Asian)IndonesianInupiatIranianIraqiIrishIroquoisIsraeliItalianJamaicanJapaneseJordanianKenyanKiowaKoreanLaotianLatvianLebaneseLiberianLithuanianLumbeeLuxembourgerMacedonianMalaysianMalteseMarshalleseMenomineeMexicanMexican American IndianMongolianMoroccanNative HawaiianNavajoNepaleseNew ZealanderNicaraguanNigerianNorthern EuropeanNorwegianOkinawanOsageOttawaPaiutePakistaniPalestinianPanamanianParaguayanPennsylvania GermanPeruvianPimaPolishPortuguesePotawatomiPuebloPuerto RicanPuget Sound SalishRomanianRussianSalvadoranSamoanScandinavianScotch-IrishScottishSeminoleSenegaleseSerbianShoshoneSierra LeoneanSiouxSlavicSlovakSloveneSomaliSouth AfricanSouth AmericanSouth American IndianSoviet UnionSpaniardSpanishSpanish AmericanSpanish American IndianSri LankanSubsaharan AfricanSudaneseSwedishSwissSyrianTaiwaneseThaiTlingit-HaidaTohono O'OdhamTonganTrinidadian and TobagonianTsimshianTurkishU.S. Virgin IslanderUgandanUkrainianUruguayanUteVenezuelanVietnameseWelshWest IndianYakamaYaquiYugoslavianYumanYup'ikZimbabwean
Immigration
NonimmigrantsImmigrantsAfghanistanAfricaAlbaniaArgentinaArmeniaAsiaAustraliaAustriaBahamasBangladeshBarbadosBelarusBelgiumBelizeBoliviaBosnia and HerzegovinaBrazilBulgariaBurma/MyanmarCabo VerdeCambodiaCameroonCanadaCaribbeanCentral AmericaChileChinaColombiaCongoCosta RicaCroatiaCubaCzechoslovakiaDenmarkDominicaDominican RepublicEastern AfricaEastern AsiaEastern EuropeEcuadorEgyptEl SalvadorEnglandEritreaEthiopiaEuropeFijiFranceGermanyGhanaGreeceGrenadaGuatemalaGuyanaHaitiHondurasHong KongHungaryIndiaIndonesiaIranIraqIrelandIsraelItalyJamaicaJapanJordanKazakhstanKenyaKoreaKuwaitLaosLatin AmericaLatviaLebanonLiberiaLithuaniaMalaysiaMexicoMicronesiaMiddle AfricaMoldovaMoroccoNepalNetherlandsNicaraguaNigeriaNorth AmericaNorth MacedoniaNorthern AfricaNorthern EuropeNorwayOceaniaPakistanPanamaPeruPhilippinesPolandPortugalRomaniaRussiaSaudi ArabiaScotlandSenegalSerbiaSierra LeoneSingaporeSomaliaSouth AfricaSouth AmericaSouth Central AsiaSouth Eastern AsiaSouthern EuropeSpainSri LankaSt. Vincent and the GrenadinesSudanSwedenSwitzerlandSyriaTaiwanThailandTrinidad and TobagoTurkeyUgandaUkraineUruguayUzbekistanVenezuelaVietnamWest IndiesWestern AfricaWestern AsiaWestern EuropeYemenZaireZimbabweAzores
11th Grade
Income
Poverty
Unemployment
Labor Participation
Family Structure
Vehicle Availability
Education Level
Disability

Blackfeet 11th Grade
Poor

92.0%
11TH GRADE
10.1/ 100
METRIC RATING
218th/ 347
METRIC RANK

Blackfeet 11th Grade Correlation Chart

The statistical analysis conducted on geographies consisting of 309,582,133 people shows a slight negative correlation between the proportion of Blackfeet and percentage of population with at least 11th grade education in the United States with a correlation coefficient (R) of -0.082 and weighted average of 92.0%. On average, for every 1% (one percent) increase in Blackfeet within a typical geography, there is a decrease of 0.017% in percentage of population with at least 11th grade education.
Blackfeet 11th Grade
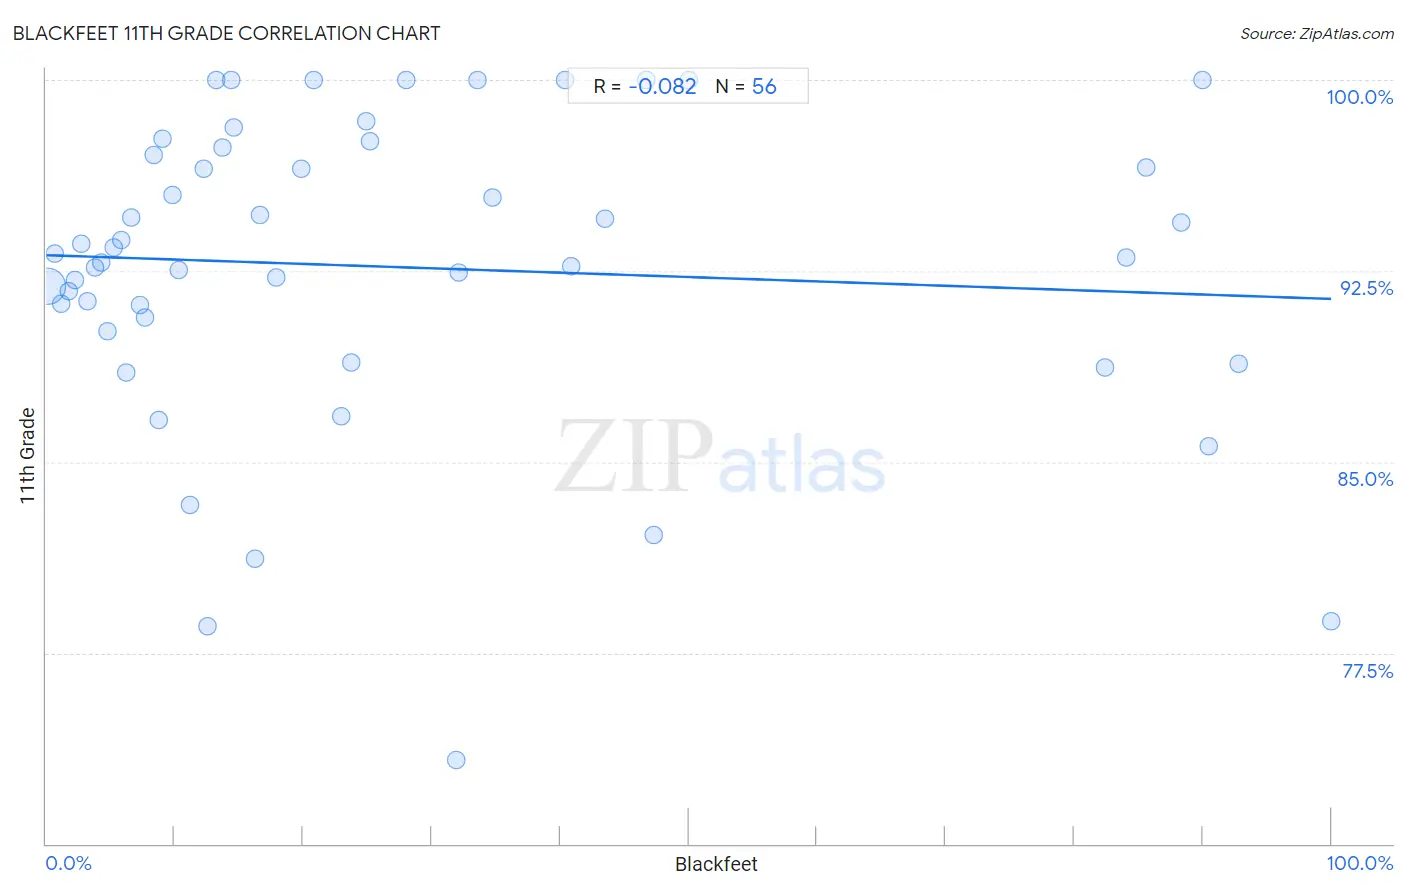
It is essential to understand that the correlation between the percentage of Blackfeet and percentage of population with at least 11th grade education does not imply a direct cause-and-effect relationship. It remains uncertain whether the presence of Blackfeet influences an upward or downward trend in the level of percentage of population with at least 11th grade education within an area, or if Blackfeet simply ended up residing in those areas with higher or lower levels of percentage of population with at least 11th grade education due to other factors.

Demographics Similar to Blackfeet by 11th Grade

In terms of 11th grade, the demographic groups most similar to Blackfeet are Portuguese (92.0%, a difference of 0.0%), Immigrants from Sierra Leone (92.0%, a difference of 0.030%), Somali (92.1%, a difference of 0.040%), Immigrants from Southern Europe (92.1%, a difference of 0.060%), and Afghan (92.1%, a difference of 0.070%).
DemographicsRating | Rank11th Grade
Immigrants from Micronesia
17.7
/100
|
#211
Poor
92.2%
Koreans
14.4
/100
|
#212
Poor
92.1%
Immigrants from Ethiopia
13.9
/100
|
#213
Poor
92.1%
Afghans
12.8
/100
|
#214
Poor
92.1%
Immigrants from Southern Europe
12.5
/100
|
#215
Poor
92.1%
Somalis
11.6
/100
|
#216
Poor
92.1%
Immigrants from Sierra Leone
11.1
/100
|
#217
Poor
92.0%
Blackfeet
10.1
/100
|
#218
Poor
92.0%
Portuguese
10.0
/100
|
#219
Tragic
92.0%
South American Indians
7.6
/100
|
#220
Tragic
92.0%
Immigrants from Liberia
7.0
/100
|
#221
Tragic
91.9%
Immigrants from Africa
6.5
/100
|
#222
Tragic
91.9%
Immigrants from Bahamas
6.5
/100
|
#223
Tragic
91.9%
Costa Ricans
6.3
/100
|
#224
Tragic
91.9%
Immigrants from Zaire
5.4
/100
|
#225
Tragic
91.9%

Blackfeet 11th Grade Correlation Summary

MeasurementBlackfeet Data11th Grade Data
Minimum0.088%73.3%
Maximum100.0%100.0%
Range99.9%26.7%
Mean27.4%92.7%
Median15.4%93.1%
Interquartile 25% (IQ1)7.0%90.4%
Interquartile 75% (IQ3)37.6%97.2%
Interquartile Range (IQR)30.6%6.8%
Standard Deviation (Sample)28.7%6.1%
Standard Deviation (Population)28.4%6.0%

Correlation Details

Blackfeet PercentileSample Size11th Grade
[
0.0%
-
0.5%
]
0.088%
300,855,53691.9%
[
0.5%
-
1.0%
]
0.68%
6,548,17793.2%
[
1.0%
-
1.5%
]
1.21%
993,98291.2%
[
1.5%
-
2.0%
]
1.73%
684,21591.7%
[
2.0%
-
2.5%
]
2.20%
216,63792.1%
[
2.5%
-
3.0%
]
2.69%
76,20993.5%
[
3.0%
-
3.5%
]
3.23%
47,11791.3%
[
3.5%
-
4.0%
]
3.76%
30,08092.6%
[
4.0%
-
4.5%
]
4.26%
32,82992.8%
[
4.5%
-
5.0%
]
4.72%
8,30490.1%
[
5.0%
-
5.5%
]
5.29%
8,42993.4%
[
5.5%
-
6.0%
]
5.82%
14,93393.7%
[
6.0%
-
6.5%
]
6.26%
9,66388.5%
[
6.5%
-
7.0%
]
6.64%
5,10794.6%
[
7.0%
-
7.5%
]
7.26%
4,21391.2%
[
7.5%
-
8.0%
]
7.67%
4,08190.7%
[
8.0%
-
8.5%
]
8.39%
3,13697.0%
[
8.5%
-
9.0%
]
8.80%
2,14886.7%
[
9.0%
-
9.5%
]
9.07%
37597.7%
[
9.5%
-
10.0%
]
9.80%
1,32695.5%
[
10.0%
-
10.5%
]
10.32%
85392.6%
[
11.0%
-
11.5%
]
11.19%
2,53883.3%
[
12.0%
-
12.5%
]
12.24%
14796.5%
[
12.5%
-
13.0%
]
12.58%
1,24078.5%
[
13.0%
-
13.5%
]
13.20%
197100.0%
[
13.5%
-
14.0%
]
13.72%
86097.3%
[
14.0%
-
14.5%
]
14.37%
167100.0%
[
14.5%
-
15.0%
]
14.58%
24098.1%
[
16.0%
-
16.5%
]
16.28%
1,25381.2%
[
16.5%
-
17.0%
]
16.67%
53494.7%
[
17.5%
-
18.0%
]
17.94%
3,06192.2%
[
19.5%
-
20.0%
]
19.83%
11696.5%
[
20.5%
-
21.0%
]
20.83%
120100.0%
[
22.5%
-
23.0%
]
22.98%
5,00886.8%
[
23.5%
-
24.0%
]
23.75%
48088.9%
[
24.5%
-
25.0%
]
24.88%
41498.4%
[
25.0%
-
25.5%
]
25.15%
16397.6%
[
28.0%
-
28.5%
]
28.00%
50100.0%
[
31.5%
-
32.0%
]
31.95%
24173.3%
[
32.0%
-
32.5%
]
32.07%
34392.4%
[
33.5%
-
34.0%
]
33.61%
244100.0%
[
34.5%
-
35.0%
]
34.78%
1,31795.4%
[
40.0%
-
40.5%
]
40.40%
151100.0%
[
40.5%
-
41.0%
]
40.90%
86392.7%
[
43.0%
-
43.5%
]
43.48%
6994.5%
[
46.5%
-
47.0%
]
46.67%
15100.0%
[
47.0%
-
47.5%
]
47.23%
27182.1%
[
50.0%
-
50.5%
]
50.00%
4100.0%
[
82.0%
-
82.5%
]
82.35%
1,65488.7%
[
84.0%
-
84.5%
]
84.09%
7,53293.0%
[
85.5%
-
86.0%
]
85.65%
87196.5%
[
88.0%
-
88.5%
]
88.34%
3,00194.4%
[
89.5%
-
90.0%
]
89.96%
229100.0%
[
90.0%
-
90.5%
]
90.43%
69085.6%
[
92.5%
-
93.0%
]
92.78%
55488.9%
[
99.5%
-
100.0%
]
100.00%
14678.7%