Blackfeet Married-couple Households
COMPARE
Blackfeet
Select to Compare
Married-couple Households
Blackfeet Married-couple Households
43.8%
MARRIED-COUPLE HOUSEHOLDS
0.2/ 100
METRIC RATING
257th/ 347
METRIC RANK
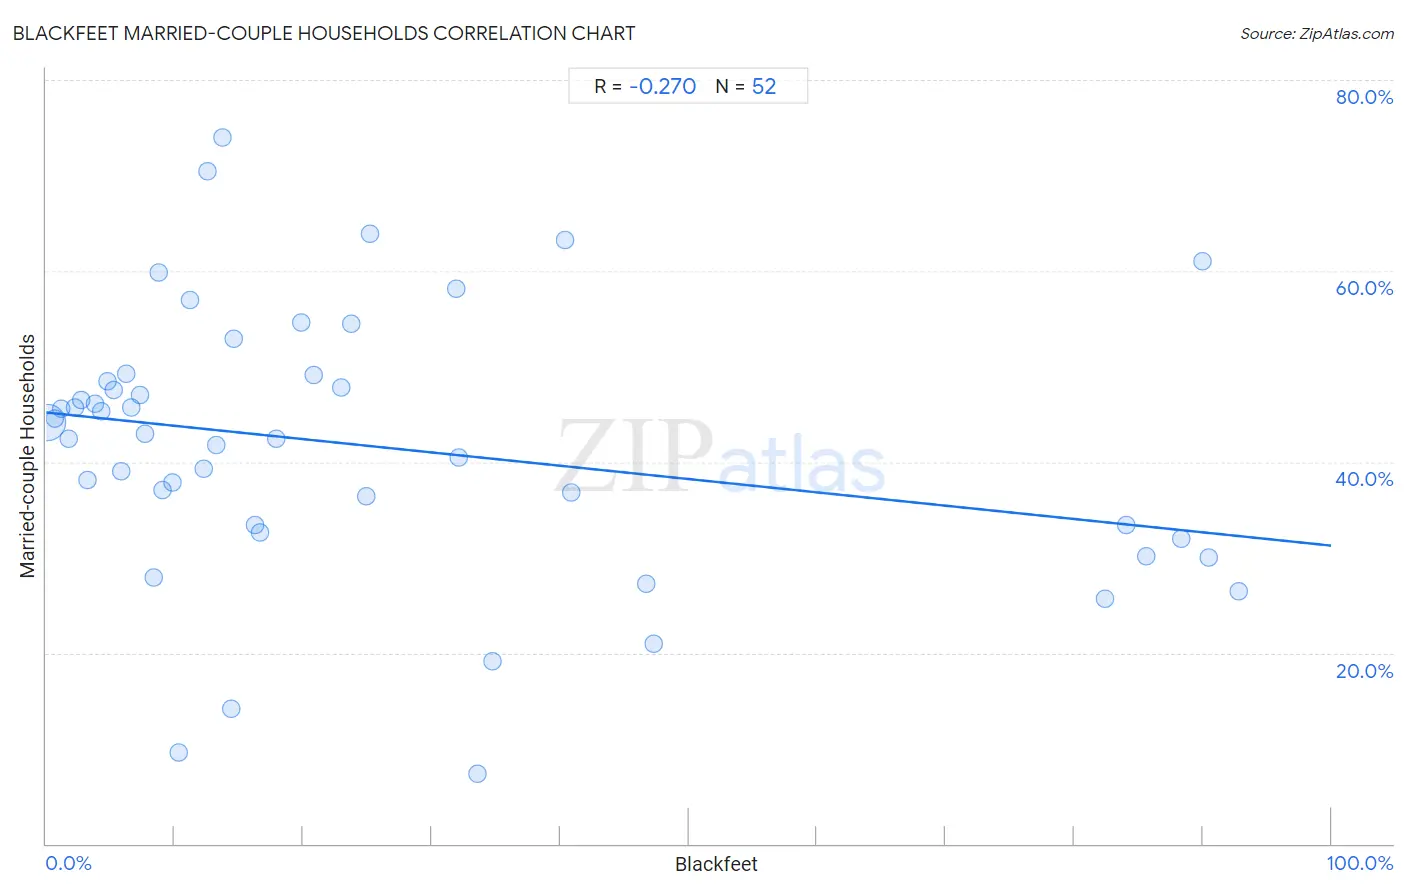
Blackfeet Married-couple Households Correlation Chart
The statistical analysis conducted on geographies consisting of 309,469,352 people shows a weak negative correlation between the proportion of Blackfeet and percentage of married-couple family households in the United States with a correlation coefficient (R) of -0.270 and weighted average of 43.8%. On average, for every 1% (one percent) increase in Blackfeet within a typical geography, there is a decrease of 0.14% in percentage of married-couple family households.
It is essential to understand that the correlation between the percentage of Blackfeet and percentage of married-couple family households does not imply a direct cause-and-effect relationship. It remains uncertain whether the presence of Blackfeet influences an upward or downward trend in the level of percentage of married-couple family households within an area, or if Blackfeet simply ended up residing in those areas with higher or lower levels of percentage of married-couple family households due to other factors.
Demographics Similar to Blackfeet by Married-couple Households
In terms of married-couple households, the demographic groups most similar to Blackfeet are Central American Indian (43.8%, a difference of 0.040%), Iroquois (43.7%, a difference of 0.070%), Immigrants from Cameroon (43.7%, a difference of 0.15%), Ugandan (43.8%, a difference of 0.16%), and Alaskan Athabascan (43.6%, a difference of 0.28%).
| Demographics | Rating | Rank | Married-couple Households |
| French American Indians | 0.4 /100 | #250 | Tragic 44.1% |
| German Russians | 0.4 /100 | #251 | Tragic 44.0% |
| Seminole | 0.4 /100 | #252 | Tragic 44.0% |
| Central Americans | 0.3 /100 | #253 | Tragic 43.9% |
| Apache | 0.3 /100 | #254 | Tragic 43.9% |
| Shoshone | 0.3 /100 | #255 | Tragic 43.9% |
| Ugandans | 0.3 /100 | #256 | Tragic 43.8% |
| Blackfeet | 0.2 /100 | #257 | Tragic 43.8% |
| Central American Indians | 0.2 /100 | #258 | Tragic 43.8% |
| Iroquois | 0.2 /100 | #259 | Tragic 43.7% |
| Immigrants from Cameroon | 0.2 /100 | #260 | Tragic 43.7% |
| Alaskan Athabascans | 0.2 /100 | #261 | Tragic 43.6% |
| Vietnamese | 0.2 /100 | #262 | Tragic 43.6% |
| Cree | 0.1 /100 | #263 | Tragic 43.6% |
| Bangladeshis | 0.1 /100 | #264 | Tragic 43.5% |
Blackfeet Married-couple Households Correlation Summary
| Measurement | Blackfeet Data | Married-couple Households Data |
| Minimum | 0.088% | 7.3% |
| Maximum | 92.8% | 74.0% |
| Range | 92.7% | 66.7% |
| Mean | 25.2% | 41.7% |
| Median | 14.0% | 42.7% |
| Interquartile 25% (IQ1) | 6.4% | 33.0% |
| Interquartile 75% (IQ3) | 32.8% | 48.8% |
| Interquartile Range (IQR) | 26.4% | 15.8% |
| Standard Deviation (Sample) | 27.6% | 14.3% |
| Standard Deviation (Population) | 27.4% | 14.1% |
Correlation Details
| Blackfeet Percentile | Sample Size | Married-couple Households |
[ 0.0% - 0.5% ] 0.088% | 300,753,393 | 44.2% |
[ 0.5% - 1.0% ] 0.68% | 6,545,520 | 44.6% |
[ 1.0% - 1.5% ] 1.21% | 989,410 | 45.5% |
[ 1.5% - 2.0% ] 1.73% | 683,700 | 42.4% |
[ 2.0% - 2.5% ] 2.20% | 215,645 | 45.7% |
[ 2.5% - 3.0% ] 2.69% | 76,209 | 46.5% |
[ 3.0% - 3.5% ] 3.23% | 47,117 | 38.1% |
[ 3.5% - 4.0% ] 3.76% | 28,981 | 46.1% |
[ 4.0% - 4.5% ] 4.26% | 32,829 | 45.4% |
[ 4.5% - 5.0% ] 4.72% | 8,304 | 48.5% |
[ 5.0% - 5.5% ] 5.29% | 8,429 | 47.5% |
[ 5.5% - 6.0% ] 5.82% | 14,933 | 39.0% |
[ 6.0% - 6.5% ] 6.26% | 9,663 | 49.2% |
[ 6.5% - 7.0% ] 6.64% | 5,107 | 45.6% |
[ 7.0% - 7.5% ] 7.26% | 4,213 | 47.1% |
[ 7.5% - 8.0% ] 7.67% | 4,081 | 43.0% |
[ 8.0% - 8.5% ] 8.39% | 3,136 | 27.9% |
[ 8.5% - 9.0% ] 8.80% | 2,148 | 59.8% |
[ 9.0% - 9.5% ] 9.07% | 375 | 37.1% |
[ 9.5% - 10.0% ] 9.78% | 1,084 | 37.9% |
[ 10.0% - 10.5% ] 10.32% | 853 | 9.5% |
[ 11.0% - 11.5% ] 11.19% | 2,538 | 57.0% |
[ 12.0% - 12.5% ] 12.24% | 147 | 39.2% |
[ 12.5% - 13.0% ] 12.58% | 1,240 | 70.4% |
[ 13.0% - 13.5% ] 13.20% | 197 | 41.8% |
[ 13.5% - 14.0% ] 13.72% | 860 | 74.0% |
[ 14.0% - 14.5% ] 14.37% | 167 | 14.1% |
[ 14.5% - 15.0% ] 14.58% | 240 | 52.9% |
[ 16.0% - 16.5% ] 16.28% | 1,087 | 33.3% |
[ 16.5% - 17.0% ] 16.67% | 534 | 32.6% |
[ 17.5% - 18.0% ] 17.94% | 3,061 | 42.5% |
[ 19.5% - 20.0% ] 19.83% | 116 | 54.5% |
[ 20.5% - 21.0% ] 20.83% | 120 | 49.1% |
[ 22.5% - 23.0% ] 22.98% | 5,008 | 47.7% |
[ 23.5% - 24.0% ] 23.73% | 354 | 54.5% |
[ 24.5% - 25.0% ] 24.88% | 414 | 36.4% |
[ 25.0% - 25.5% ] 25.15% | 163 | 63.9% |
[ 31.5% - 32.0% ] 31.95% | 241 | 58.2% |
[ 32.0% - 32.5% ] 32.07% | 343 | 40.5% |
[ 33.5% - 34.0% ] 33.61% | 244 | 7.3% |
[ 34.5% - 35.0% ] 34.78% | 1,317 | 19.1% |
[ 40.0% - 40.5% ] 40.40% | 151 | 63.2% |
[ 40.5% - 41.0% ] 40.90% | 863 | 36.8% |
[ 46.5% - 47.0% ] 46.67% | 15 | 27.3% |
[ 47.0% - 47.5% ] 47.23% | 271 | 20.9% |
[ 82.0% - 82.5% ] 82.35% | 1,654 | 25.7% |
[ 84.0% - 84.5% ] 84.09% | 7,532 | 33.4% |
[ 85.5% - 86.0% ] 85.65% | 871 | 30.1% |
[ 88.0% - 88.5% ] 88.34% | 3,001 | 32.0% |
[ 89.5% - 90.0% ] 89.96% | 229 | 61.0% |
[ 90.0% - 90.5% ] 90.43% | 690 | 29.9% |
[ 92.5% - 93.0% ] 92.78% | 554 | 26.4% |